
This insightful tool can help predict credit crunches before they happen… here’s what it’s saying today

Credit markets often hold the key to understanding the broader economy. While some specific company bankruptcies tend to scare investors, it’s necessary to look at the entire credit market to see what’s in store for the equity market.
Today, we will look at aggregate Uniform Accounting data to see if there is anything to be worried about in credit land.
Investor Essentials Daily:
The Monday Macro Report
Powered by Valens Research
Bondholders are receiving almost nothing from corporate bankruptcies these days. As this Bloomberg article highlights, investors during the pandemic are now seeing three cents on the dollar or less during liquidations.
The state of the economy over the past decade has driven this reduction in yields. The mix of a 10-year bull market in equities and low interest rates has pushed bond investors to search high and low for yield.
To get higher yields on their bond investments, investors bought “covenant-lite” bonds. Additionally, companies began taking on more debt as interest rates were so low. The lack of bond covenants also allowed companies to borrow against assets like software, intellectual property, and brands.
With low interest rates and a growing economy, the risky debt did not have much of an adverse effect on credit holders. However, the pandemic has changed that.
Many companies suddenly saw large losses in profitability when lockdowns took place across the country, forcing some of them into bankruptcy. Without protections in place, some of these bankruptcies in recent months have completely wiped investors out.
This trend has people worried about the potential for a larger wave of bankruptcies. In that case, credit investors could lose an immense amount of money. As such, it’s important to see how likely a credit crunch may be.
First, it is necessary to look at coronavirus cases.
Global cases are again on the rise. The U.S. appears to be entering a “third wave” of coronavirus cases spiking. To keep citizens safe, some national governments are closing down parts of their countries.
Just recently, France, the U.K., and Germany announced various levels of national lockdowns.
To add further difficulties, the northern hemisphere is fast approaching winter. This means temperatures are falling fast.
Over the past months, many businesses have moved services outdoors to allow for safe attendance. For many restaurants and brick-and-mortar stores, outdoor areas were the only way to drive income.
With temperatures dropping, many businesses will lose this income.
Understandably, this has investors looking to credit health. Investors want to make sure companies have the cash to pay off obligations. If companies can’t pay off debts, they may go under.
Some folks are worried about the possibility of this shake-up affecting the entire economy. To understand if companies can pay off their obligations, we can use our aggregate Credit Cash Flow Prime (CCFP) analysis.
One of the tools we leverage at Valens is combining our company specific data to see wider economic trends. The aggregate CCFP gives us insight into how healthy the entire country’s corporate balance sheet is.
The chart below shows aggregate credit risk. The stacked bars are the aggregate market’s obligations for the next five years. We compare this to cash flows (the blue line) and cash on hand at the beginning of each period (the blue dots)
The bottom bars are the ones hardest for firms to “push off.” These are costs such as debt maturities and interest expense. The top bars are obligations that are more discretionary, like maintenance capital expenditures and share buybacks.
The graph shows cash flows alone are not enough to pay off obligations for companies. However, firms have enough cash on hand and cash flows to survive the next four years without having to borrow more or make tough decisions about cutting obligations. In addition, there is a considerable amount of capex flexibility for companies.
The capex flexibility and multi-year runway give companies years to improve operations to meet future obligations. This makes the bond markets safer than they initially appear.
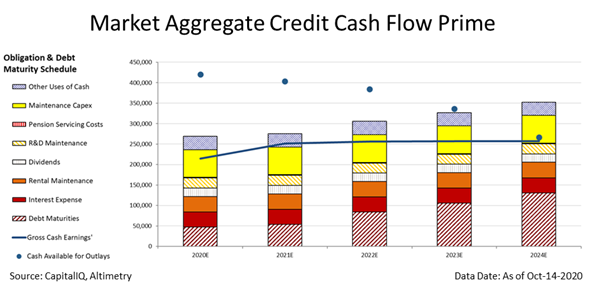
Moreover, the graph may even be overstating the debt maturities coming due in the next three years.
This is because investment grade and high yield credit names have issued over $1.4 trillion in debt over the past six months. The new debt has helped them refinance near-term maturities and raise capital.
Those lowest bars, the debt maturity obligations, are likely lower than this chart reflects for the next two to three years because of this refinancing.
Overall, the current credit market is in a healthy place. The aggregate CCFP shows companies have material amounts of cash on hand. While cash flows are lower this year, companies can use cash on hand to cover any shortfalls.
While rising coronavirus cases can be scary for markets, companies have the liquidity to weather the storm.
Best regards,
Joel Litman & Rob Spivey
Chief Investment Strategist &
Director of Research
at Valens Research


