
This investing great got his start by applying Machiavellian principles, Uniform Accounting shows what he’s working on now

This activist investor has lived by Machiavelli’s mantra when dealing with the companies he invests in and it has benefited him significantly.
He is comfortable doing what it takes to unlock value in his firms, but GAAP as-reported financial metrics make it look like he’s betting on turnarounds that could be much more hit or miss than he’s likely expecting.
In reality, UAFRS-based financial metrics help make sense of the stocks he is buying and how they line up perfectly.
In addition to examining the portfolio, we’re including a deeper look into the fund’s largest current holding, providing you with the current Uniform Accounting Performance and Valuation Tearsheet for that company.
Investor Essentials Daily:
Friday Uniform Portfolio Analytics
Powered by Valens Research
Niccolo Machiavelli’s The Prince has been a required reading in political philosophy classes, and in many C-suites and finance circles for 500 years.
The Florentine’s philosophy famously espoused in the book is “the ends justify the means,” meaning if you achieve your desired goal, then how you got there doesn’t matter.
People often take this in a negative light, but doing whatever it takes for what you think is right fits under that same heading. Sometimes a Machievellian philosophy could be appropriate.
That’s what Chris Hohn’s philosophy has been.
After leaving Perry Capital, Hohn founded The Children’s Investment Fund Management (TCI). Initially when the firm was founded it would donate a portion of its profits and AUM each year to his charity for children living in poverty, The Children’s Investment Fund Foundation.
He did this to motivate himself to maximize returns. And it certainly appeared to motivate him to “do whatever it takes” to make companies create value.
Over the years, the fund has taken an activist position in multiple investments, from Volkswagen to Safran, to Heathrow’s owner Ferrovial, and even against ABN AMRO in 2007.
Hohn has no reason to step away from his Machiavellian ways either, since they’ve been working. TCI was up 41% in 2019, and has made money every year since losing money in 2008.
As an activist investor, one might expect that Hohn is generally focused on broken companies he can fix, and that is what the as-reported metrics appear to reflect.
In reality though, Hohn and TCI are focused on high-quality companies, where they want the company to do something to unlock the value already in the firm, be it forcing a merger or break-up, reigning in management pay, or opening a dialog about corporate strategy.
But Hohn’s strategy is only apparent when looking at the Uniform Accounting numbers for his investments.
We’ve conducted a portfolio audit of TCI’s holdings, based on their most recent 13-F.
We’re showing a summarized and abbreviated analysis of how we work with institutional investors to analyze their portfolios.
Unsurprisingly, while TCI’s investments’ as-reported metrics make it look like TCI has lost its way, in reality, the fund appears to be higher quality names once Uniform Accounting metrics are reviewed.
It’s clear that when Hohn and TCI are making their investment decisions, they’re making decisions based on the real data.
See for yourself below.
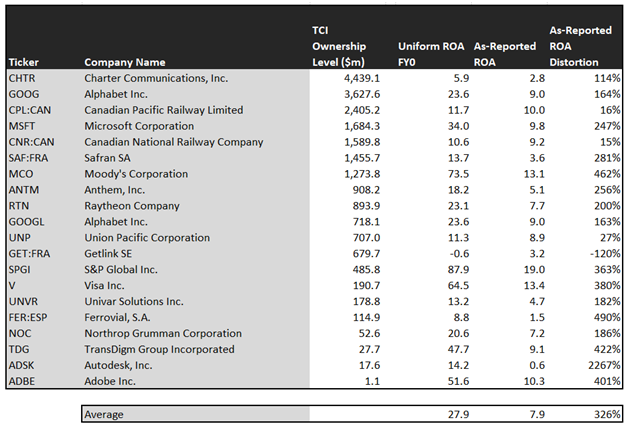
Using as-reported accounting, investors would think TCI is investing in low-return businesses and hoping to turn them around.
On an as-reported basis, many of these companies are poor performers with returns below 6%, and the average as-reported return on assets (ROA) is at 8%.
In reality, the average company in the portfolio displays an impressive average Uniform ROA at 28%. That’s well above corporate average returns currently.
Once we make Uniform Accounting (UAFRS) adjustments to accurately calculate earning power, we can see that the returns of the companies in Hohn’s portfolio are much more robust.
Once the distortions from as-reported accounting are removed, we can realize that Microsoft (MSFT) doesn’t have an 10% ROA, it is actually at 34%. Microsoft is a strongly profitable software company.
Similarly, Moody’s (MCO) ROA is really 74%, not 13%. While as-reported metrics are portraying the company as a low return business, Uniform Accounting shows the company’s real robust operations thanks to its oligopoly with S&P and Fitch.
TransDigm (TDG), another major TCI holding, is another great example of as-reported metrics misrepresenting the company’s profitability.
TransDigm doesn’t have a 9% ROA, it is actually at 48%. TCI appears to understand that market expectations for the company, thinking it’s a low return roll-up, is completely incorrect.
The list goes on from there, for names ranging from Alphabet (GOOGL) and Safran (ENXTPA:SAF), to Anthem (ANTM), Raytheon (RTN), and S&P Global (SPGI).
If TCI were focused on as-reported metrics, it likely wouldn’t spend time trying to invest in and change these companies, as it would view them as low-return commodity businesses where there wasn’t value to be unlocked.
But to find companies that can deliver alpha beyond the market, just finding companies where as-reported metrics misrepresent a company’s real profitability is insufficient.
To really generate alpha, any investor also needs to identify where the market is significantly undervaluing the company’s potential.
TCI is also investing in companies that the market has low expectations for, low expectations the companies can exceed.

This chart shows three interesting data points:
- The 2-year Uniform EPS growth represents what Uniform earnings growth is forecast to be over the next two years. The EPS number used is the value of when we take consensus Wall Street estimates and we convert them to the Uniform Accounting framework.
- The market expected Uniform EPS growth is what the market thinks Uniform earnings growth is going to be for the next two years. Here, we show by how much the company needs to grow Uniform earnings in the next 2 years to justify the current stock price of the company. If you’ve been reading our daily and our reports for a while, you’ll be familiar with the term embedded expectations. This is the market’s embedded expectations for uniform earnings growth.
- The Uniform EPS growth spread is the spread between how much the company’s Uniform earnings could grow if the Uniform earnings estimates are right, and what the market expects Uniform earnings growth to be.
The average company in the US has been forecast to have 5% annual Uniform Accounting earnings growth over the next 2 years. TCI’s holdings are forecast by analysts to outpace that, growing at a robust 13% a year the next 2 years, on average.
Hohn is not just finding high quality, higher growth companies though, he and his team are finding mispriced companies.
On average, the market is pricing these companies to only grow earnings by 7% a year. While these companies are growing robustly, they are intrinsically undervalued, as the market is mispricing their growth by 6% on average.
These are the kinds of companies that are likely to see their stocks rally when the market realizes how wrong it is. Without Uniform numbers, the GAAP numbers would leave everyone confused. And the risk of returns collapsing is low, considering how high quality these companies are.
One example of a company in the TCI portfolio that has growth potential that the market is mispricing is Alphabet (GOOGL). Alphabet’s Wall Street analyst forecasts have 8% Uniform earnings growth built in, but the market is pricing the company to have earnings shrink by 3% each year for the next two years.
Another company with similar dislocations is Autodesk (ADSJ). Expectations may look high with market expectations for a 56% growth in earnings. However the company is actually forecast for Uniform EPS to grow by 102% a year. While expectations are for robust growth already, if it can deliver higher growth, there’s more upside.
Yet another is the fund’s largest holding, Anthem (ANTM), is priced for an 3% shrinkage in Uniform earnings, when the company is forecast to grow by earnings by 21% a year.
That being said, there are a few companies we’d recommend TCI look at again before holding, unless they have a very aggressive activist strategy.
Charter Communications (CHTR) is forecast to see Uniform earnings shrink by 11% a year going forward. However, the market is pricing the company for 8% annual earnings growth.
This doesn’t look like an intrinsically undervalued company. If anything, the market looks significantly too bullish.
But many of TCI’s holdings look like a high-quality, undervalued set of stocks with businesses displaying strong earning power. Companies that the market misunderstands that are ripe for activists to draw attention to the firm.
It wouldn’t be clear under GAAP, but unsurprisingly Uniform Accounting sees the same signals that TCI and Chris Hohn appear to be looking at.
Charter Communications, Inc. Tearsheet
As TCI Fund Management’s largest individual stock holding, we’re highlighting Charter Communications’ tearsheet today.
As the Uniform Accounting tearsheet for Charter Communications, Inc. (CHTR:USA) highlights Charter Communications’ Uniform P/E trades at 34.1x, above the corporate average valuation levels and its own recent history.
High P/Es require high EPS growth to sustain them. In the case of Charter Communications, the company recently had a -21% Uniform EPS growth.
While Wall Street stock recommendations and valuations poorly track reality, Wall Street analysts have a strong grasp on near-term financial forecasts like revenue and earnings.
As such, we use Wall Street GAAP earnings estimates as a starting point for our Uniform Earnings forecasts. When we do this, we can see that Charter Communications is forecast Uniform EPS to shrink by 19% in 2019 and shrink by 1% in 2020.
Based on current stock market valuations, we can back into the required earnings growth rate that would justify $440 per share. These are often referred to as market embedded expectations.
In order to meet the current market valuation levels of Charter Communications, the company would have to grow Uniform EPS by 8% each year over the next three years.
What Wall Street analysts expect for Charter Communications’ earnings growth is below what the current stock market valuation requires.
The company’s earning power, based on its Uniform return on assets calculation, is at 1x corporate average returns.
Furthermore, cash flows and cash on hand falls below total obligations. But with the company’s moderate operating risk and refinancing capability, credit risk remains low.
To conclude, Charter Communications’ Uniform earnings growth is below peer averages in 2019. Also, the company is trading above peer valuations.
Best regards,
Joel Litman & Rob Spivey
Chief Investment Strategist &
Director of Research
at Valens Research