
This investor has made a career for betting on the little guy, Uniform Accounting shows why he keeps making winning bets

This great investment has focused on investing in smaller things with bigger upside in both his personal and professional lives. The bet that small things can make big impacts has paid off for him for the past 50 years and more.
He’s always had a specific strategy when investing small, but using GAAP as-reported financial metrics, the investments in his fund’s portfolio look like he’s not following his self-stated strategy.
In reality, UAFRS-based financial metrics help make sense of the stocks he is buying, and how they line up perfectly.
In addition to examining the portfolio, we’re including a deeper look into the fund’s largest current holding, providing you with the current Uniform Accounting Performance and Valuation Tearsheet for that company.
Investor Essentials Daily:
Friday Uniform Portfolio Analytics
Powered by Valens Research
Rhode Island is the smallest of the 50 states in the US. However, that hasn’t prevented it from making a major impact on the future of the United States, and on history.
Rhode Island was the first state to declare independence from Great Britain.
Samuel Slater also chose Rhode Island to start the industrial revolution in the US. He helped power future US economic growth by deploying the first US water-powered cotton mill in the state.
Rhode Island was also the first US state to legally abolish slavery. Furthermore, representatives of the state were one of the major drivers behind the adoption of the Bill of Rights, the first ten amendments to the US Constitution, focusing on rights that are protected from laws.
For such a small state, Rhode Island has certainly had an outsized impact on American history.
So it’s unsurprising that Chuck Royce would be so deeply connected to the state’s history.
Royce is well travelled in the state’s circles. He is a Brown alumni, and is widely credited with saving Westerly, and helping it regain its charm as a summertime vacation oasis with his rescue of the Watch Hill resort.
Royce has a long history of understanding that a small package can yield outsized returns.
He has been at the forefront of smallcap and microcap investing since he took over what is now called Royce funds, back in 1972.
One of the core premises of his and his firm’s investment strategy is to invest in high quality, value smallcap stocks.
The focus on smallcap is because Royce knew what Fama and French eventually proved two decades later in 1992, smaller companies outperform larger companies. It is easier for a smaller company to double their client base than for a large company to find twice as many customers.
The idea behind a focus on quality is because quality is even more important in the smallcap world than elsewhere, because the margin of safety for smallcap companies, which are less diverse and generally have smaller safety nets, is more reduced.
Having high returns and low leverage reduces the risk that a smallcap idea blows up.
Finally, a focus on value makes sense, as like Buffett or Graham, Royce talks about wanting to get into companies at a smart price that he’d like to own forever.
That being said, analyzing Royce’s portfolio, it’s not obvious that the fund invests in either high quality or undervalued names using as-reported metrics.
We’ve conducted a portfolio audit of Royce’s top holdings, based on their most recent 13-F, excluding ETF holdings.
We’re showing a summarized and abbreviated analysis of how we work with institutional investors to analyze their portfolios.
Unsurprisingly, while Royce’s investments’ as-reported metrics make it look like Royce has lost its way, in reality they appear to be higher quality names, once Uniform Accounting metrics are reviewed.
It’s clear that when Chuck and his portfolio managers are making their investment decisions, they’re making decisions based on the real data.
See for yourself below.
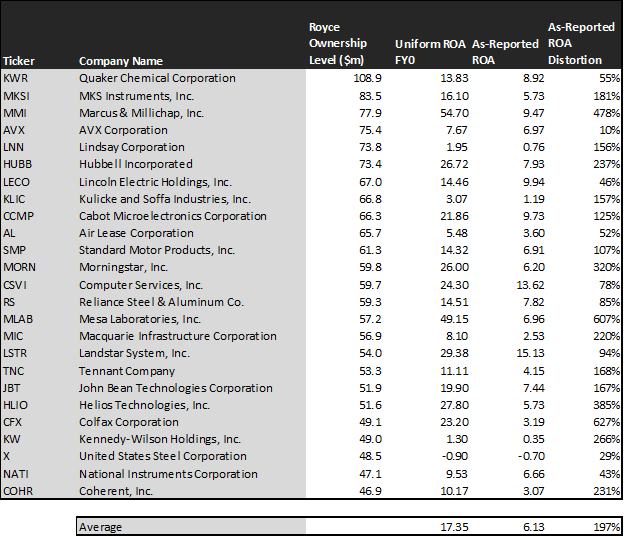
Using as-reported accounting, investors would think Royce has lost its way and wandered away from the mandate that made it such a massive smallcap investing success.
On an as-reported basis, many of these companies are poor performers with returns below 9%, and the average as-reported return on assets (ROA) is right at 6%.
In reality, the average company in the portfolio displays an impressive average Uniform ROA at 17%. That’s above corporate average returns currently.
Once we make Uniform Accounting (UAFRS) adjustments to accurately calculate earning power, we can see that the returns of the companies in Royce’s portfolio are much more robust.
Once the distortions from as-reported accounting are removed, we can realize that Quaker Chemical (KWR) doesn’t have a 9% ROA, it is actually at 14%. Quaker, Royce’s largest investment, is a strongly profitable chemical company.
Similarly, Royce’s second largest investment MKS Instruments’ (MKSI) ROA is really 16%, not 6%. While as-reported metrics are portraying the company as a low return semiconductor business, Uniform Accounting shows the company’s real robust operations.
Marcus & Millichap, Inc (MMI), Royce’s third largest position, is another great example of as-reported metrics mis-representing the company’s profitability.
Marcus & Millichap doesn’t have a 10% ROA, it is actually at 55%. Royce appears to understand that market expectations for the company, thinking it’s a low return business, is completely incorrect.
The list goes on from there, for names ranging from Hubbell (HUBB) and Cabot Microelectronics (CCMP), to Morningstar (MORN), Mesa Labs (MLAB), and Helios Technologies (HLIO).
If Royce were focused on as-reported metrics, it would never pick most of these companies because they look like anything but the high-quality companies that are the fund group’s mandate.
But to find companies that can deliver alpha beyond the market, just finding companies where as-reported metrics mis-represent a company’s real profitability is insufficient.
To really generate alpha, any investor also needs to identify where the market is significantly undervaluing the company’s potential.
Royce is also investing in companies that the market has low expectations for, low expectations the companies can exceed.
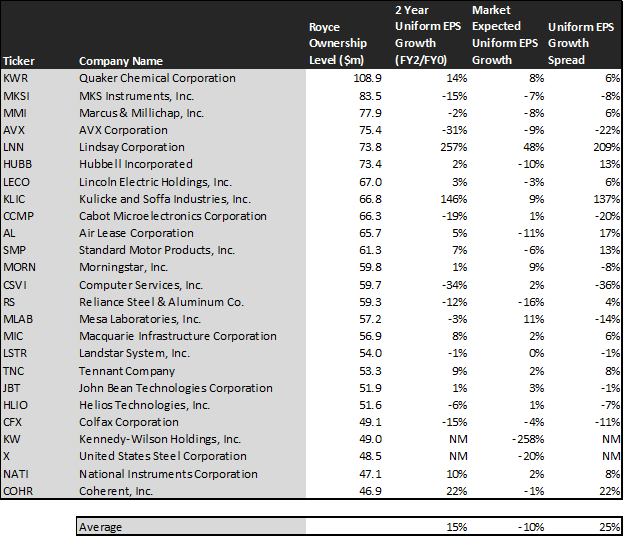
This chart shows three interesting data points:.
- The 2-year Uniform EPS growth represents what Uniform earnings growth is forecast to be over the next two years. The EPS number used is the value of when we take consensus Wall Street estimates and we convert them to the Uniform Accounting framework.
- The market expected Uniform EPS growth is what the market thinks Uniform earnings growth is going to be for the next two years. Here, we show by how much the company needs to grow Uniform earnings in the next 2 years to justify the current stock price of the company. If you’ve been reading our daily and our reports for a while, you’ll be familiar with the term embedded expectations. This is the market’s embedded expectations for uniform earnings growth.
- The Uniform EPS growth spread is the spread between how much the company’s Uniform earnings could grow if the Uniform earnings estimates are right, and what the market expects Uniform earnings growth to be.
The average company in the US is forecast to have 5% annual Uniform Accounting earnings growth over the next 2 years. Royces holdings are forecast by analysts to outpace that, growing at a robust 15% a year the next 2 years, on average.
Royce is not just finding high quality, higher growth companies though, it is finding mispriced companies.
On average, the market is pricing these companies to shrink earnings by 10% a year. While these companies are growing robustly, they are intrinsically undervalued, as the market is mispricing their growth by 25% on average.
These are the kinds of companies that are likely to see their stocks rally when the market realizes how wrong it is. Without Uniform numbers, the GAAP numbers would leave everyone confused. And the risk of returns collapsing is low, considering how high quality these companies are.
One example of a company in the Royce portfolio that has growth potential that the market is mispricing is Kulicke and Soffa (KLIC). Kuicke and Soffa’s Wall Street analyst forecasts have 146% Uniform earnings growth built in, but the market is pricing the company to have earnings grow by 9% each year for the next two years.
Another company with similar dislocations is Lindsay Corp (LNN). Expectations may look high with market expectations for a 48% growth in earnings. However the company is actually forecast for Uniform EPS to grow by 257% a year. While expectations are high, if it can deliver higher growth, there’s more upside.
Yet another is the fund’s largest holding, Air Lease (AL), is priced for an 11% shrinkage in Uniform earnings, when the company is forecast to grow by earnings by 5% a year.
That being said, there are a few companies we’d recommend Royce look at again before holding.
Computer Services (CSVI) is forecast to see Uniform earnings shrink by 34% a year going forward. However, the market is pricing the company for 2% annual earnings growth.
This doesn’t look like an intrinsically undervalued company. If anything, the market looks significantly too bullish.
But many of Royce’s holdings look like a high quality, undervalued set of stocks with businesses displaying strong earning power. It wouldn’t be clear under GAAP, but unsurprisingly Uniform Accounting sees the same signals that Royce appears to.
Quaker Chemical Corporation Tearsheet
As Royce Investment Partner’s largest individual stock holding, we’re highlighting Quaker Chemical’s tearsheet today.
As our Uniform Accounting tearsheet for Quaker Chemical Corporation (KWR:USA) highlights, Quaker Chemical’s Uniform P/E trades at 26.7x, above the corporate average valuation levels, but below its own recent history.
High P/Es require high EPS growth to sustain them. In the case of Quaker Chemical, the company recently had a 26% Uniform EPS growth.
While Wall Street stock recommendations and valuations poorly track reality, Wall Street analysts have a strong grasp on near-term financial forecasts like revenue and earnings.
As such, we use Wall Street GAAP earnings estimates as a starting point for our Uniform Earnings forecasts. When we do this, we can see that Quaker Chemical is forecast to only see Uniform EPS of -58% in 2019 followed by 210% in 2020.
Based on current stock market valuations, we can back into the required earnings growth rate that would justify $158 per share. These are often referred to as market embedded expectations.
In order to meet the current market valuation levels of Quaker Chemical, the company would have to grow Uniform EPS by 8% each year over the next three years.
What Wall Street analysts expect for Quaker Chemical’s earnings growth is far above than what the current stock market valuation requires.
The company’s earning power, based on its Uniform return on assets calculation, is at more than 2x corporate average returns. Furthermore, with cash flows and cash on hand consistently exceeding debt obligations, Quaker Chemical has low credit and dividend risk.
To conclude, Quaker Chemical’s Uniform earnings growth is below peer averages in 2019. Also, the company is trading above peer valuations.
Best regards,
Joel Litman & Rob Spivey
Chief Investment Strategist &
Director of Research
at Valens Research