
This investor’s big call on the pandemic led to a second record-breaking year

By continuing to live on the edge, this fund manager has followed a strategy that has made him billions of dollars, despite almost sinking his career numerous times.
While dismissed at first, his early understanding of the risks of the COVID-19 pandemic helped him achieve a second consecutive year of market-leading, record-breaking performance.
Using GAAP as-reported financial metrics, one would be warranted in questioning his portfolio’s composition and investment process.
But utilizing UAFRS-based financial metrics, it is clear how this fund manager has bought stocks with very attractive upside signals, even if his current performance may not continue.
In addition to examining the portfolio, we’re including a deeper look into the fund’s largest current holding, providing you with the current Uniform Accounting Performance and Valuation Tearsheet for that company.
Investor Essentials Daily:
Friday Uniform Portfolio Analytics
Powered by Valens Research
After posting a record performance in 2019, reporting a 58% gain over the course of the year, Bill Ackman’s hedge fund Pershing Square Capital Management bested its own record in 2020, posting a preposterous 70% return.
In both years, this performance helped Pershing Square annihilate stock market returns and placed it firmly towards the top of fund performances. Given its impressive run of results, we felt it was appropriate to revisit the company’s portfolio after first examining it in February of last year.
A prominent activist investor, Bill Ackman has built himself a reputation on Wall Street. His unique style of portfolio management helps position his fund to reap tremendous returns, while sometimes opening the door for significant losses.
Along with a steadfast commitment to long-term-oriented activism, Ackman is well-known for his hyper-concentrated portfolios, alongside historical success investing in companies with real estate-related exposure.
Ackman’s focus on real estate shouldn’t come as much of a surprise, given his family’s long-running history in the real estate business. His grandfather founded a real estate investment and development firm in the 1920s. His father then took over the firm in the 1960s, where he helped the firm focus on other aspects of real estate financing.
Some of Ackman’s greatest successes, such as his short bet on MBIA ahead of the financial crisis and his successful investment in General Growth Properties in the midst of the Great Recession, have been thanks to his real estate acumen.
Often, Ackman’s least successful investments, such as Valeant or Herbalife, are from when he ventured away from investments that had some real estate component.
That said, Ackman has also proven he isn’t a “one-trick pony”. Pershing Square’s recent successes have come from largely non-real estate focused investments.
Recognizing the threat of the COVID-19 pandemic early on, Ackman considered liquidating his entire portfolio before deciding to pursue a credit-hedge strategy. The fund took on exposure to the credit default swap market in anticipation of credit spreads widening as the country shut down.
This hedge paid off big-time, returning about $2.6 billion to the fund, or about 100 times the size of the original investment.
This success more than offset the losses felt across the rest of his concentrated portfolio. And in early April, Ackman was able to use the proceeds of the trade to reinvest in his portfolio at fire-sale prices, betting on an economic recovery.
Currently, Pershing Square only has 7 holdings. Lowe’s (LOW) was over 23% of the fund’s holdings as of the form 13F the company filed on October 23rd. Both Restaurant Brands (QSR) and Chipotle (CMG) represented another 16% each of the fund’s capital.
For context, Third Point, a fund run by activist Dan Loeb, owns 47 different equity positions. Carl Icahn’s Icahn Enterprises owns hundreds of stocks.
This extreme concentration is a signal of high conviction in Pershing Square’s investments. It is also a signal that Ackman’s goal is not wealth preservation, but maximum wealth accumulation for himself and his investors.
Considering Pershing Square’s highly focused investment strategy, one would expect that Ackman and his team are turning over every rock to make sure they know a company completely.
When looking at the fund’s holdings using as-reported metrics, investors might think Pershing Square is buying some very poor performing turnaround candidates in the hopes activism will drive a turnaround.
But in reality, Uniform Accounting analytics highlight that Ackman is often targeting companies with already strong profitability. These are companies where he doesn’t have to worry about economic moats being disrupted, but where he thinks he can unlock greater value.
We’ve conducted a portfolio audit of Pershing Square’s top equity holdings.
Unsurprisingly, for the most part, Pershing Square’s analytics appear to be steering the portfolio to companies that Uniform Accounting metrics highlight are much higher quality and have higher potential than the market and as-reported metrics imply.
Because Uniform Accounting identifies real corporate performance compared to distorted as-reported metrics, UAFRS lines up better with the deep fundamental analysis Ackman and the Pershing Square team are doing.
See for yourself below.
Using as-reported accounting, investors would be questioning Ackman’s willingness to take such massive bets on the companies Pershing Square owns.
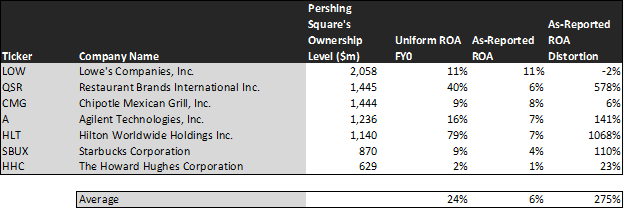
On an as-reported basis, several of these companies are poor performers, with a return on assets (ROA) below 10% and the average at around 6%.
However, the average company in the portfolio displays an impressive average ROA of 24%. That’s well above corporate average profitability.
On an as-reported financial metric basis, it would appear that Pershing Square would need to be an excellent activist fund and completely turnaround companies with weak profitability.
However, when looking at the companies Ackman is buying on a Uniform basis, it’s clear he is betting on high-quality companies where he can unlock more value.
Once the distortions from as-reported accounting are removed, we can realize that Restaurant Brands, the owner of Burger King, Tim Hortons, and Popeye’s, doesn’t have a cost-of-capital 6% ROA, but returns at 40%. It appears Ackman is attracted to the firm’s powerful franchising model built around delivery and drive-thru oriented businesses.
Meanwhile, Hilton Worldwide’s (HLT) ROA isn’t a pitiful 7%, but 79%. As an asset-light hotel operator also built off a highly lucrative franchise model, it comes as no surprise that Ackman has decided to hang his hat on its recovery.
If Pershing Square’s research was powered by as-reported metrics, the fund would never pick these companies because they look like struggling companies and tiresome turnarounds.
That said, to find companies that can deliver alpha beyond the market, as Pershing Square has done remarkably over the past two years, any investor needs to identify where the market is significantly undervaluing a company’s potential.
Specifically, examining EPS growth and market expectations can help shed light on whether the firm’s blistering pace can continue.
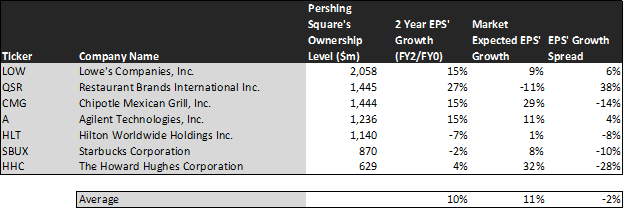
This chart shows three interesting data points:
- The 2-year Uniform EPS growth represents what Uniform earnings growth is forecast to be over the next two years. The EPS number used is the value of when we take consensus Wall Street estimates and we convert them to the Uniform Accounting framework.
- The market expected Uniform EPS growth is what the market thinks Uniform earnings growth is going to be for the next two years. Here, we show by how much the company needs to grow Uniform earnings in the next 2 years to justify the current stock price of the company. If you’ve been reading our daily analyses and reports for a while, you’ll be familiar with the term embedded expectations. This is the market’s embedded expectations for Uniform earnings growth.
- The Uniform EPS growth spread is the spread between how much the company’s Uniform earnings could grow if the Uniform earnings estimates are right, and what the market expects Uniform earnings growth to be.
The average company in the US is forecast to have 5% annual Uniform Accounting earnings growth over the next 2 years. Pershing Square’s holdings are forecast by analysts to outpace that, growing at a stronger 10% a year the next 2 years, on average.
But while Pershing Square is finding high-quality companies, not all of its holdings are favorably mispriced. The market is pricing these companies to grow earnings by 11% a year, meaning that, on average, analyst expectations are in line with the market.
For some names, such as Chipotle Mexican Grill, markets have high expectations, pricing in a lofty 29% EPS growth over the next two years, while analysts anticipate a lower, yet still robust 15% EPS growth over that same time period.
Similarly, while the market expects Starbucks (SBUX) to experience 8% EPS growth in the next couple years, analysts anticipate a 2% EPS shrinkage over the next two years.
Both these names experienced strong recoveries over the course of the year, helping to fuel Pershing Square’s performance. At current levels, perhaps they have overshot their values, as expectations may be hard to achieve.
On the other hand, Ackman’s portfolio also contains names that continue to appear significantly undervalued.
Namely, Restaurant Brands has very bearish expectations priced in, and would just need to see EPS fall by less than 11% to outperform market sentiment. With projected analyst EPS growth of over 27% over the next two years, this name could be a rocket ship if analysts are correct.
In total, while the portfolio exceeds average Uniform Accounting earnings growth, some individual names seem to have had their rallies take them into overvalued territory, while others look like they have more room to run.
When looking at Pershing Square through a Uniform Accounting lens, the methodology of Ackman’s picks can be revealed. Following its recent string of success, it is hard to argue with Bill Ackman’s selection process, yet the strength of its picks going into 2020 remains uncertain.
For the most part, Pershing Square’s portfolio looks like a set of high-quality stocks with businesses displaying strong earning power and opportunity for activism to accelerate this.
It wouldn’t be clear under GAAP, but unsurprisingly Uniform Accounting allows investors to see similar signals to the largest funds.
SUMMARY and Lowe’s Companies, Inc. Tearsheet
As Pershing Square’s largest individual stock holdings, we’re highlighting Lowe’s (LOW:USA) tearsheet today.
As the Uniform Accounting tearsheet for Lowe’s highlights, its Uniform P/E trades at 23.8x, which is around global average valuation levels and its average valuations.
Moderate P/Es require moderate EPS growth to sustain them. In the case of Lowe’s, the company has recently shown a 43% Uniform EPS growth.
Wall Street analysts provide stock and valuation recommendations that in general provide very poor guidance or insight. However, Wall Street analysts’ near-term earnings forecasts tend to have relevant information.
We take Wall Street forecasts for GAAP earnings and convert them to Uniform earnings forecasts. When we do this, Lowe’s Wall Street analyst-driven forecast is 50% and 11% Uniform EPS growth in 2021 and 2022, respectively.
Based on current stock market valuations, we can use earnings growth valuation metrics to back into the required growth rate to justify Lowe’s $166 stock price. These are often referred to as market embedded expectations.
In order to justify current market expectations, Lowe’s would need to have Uniform earnings grow by 10% each year over the next three years. What Wall Street analysts expect for Lowe’s earnings growth is above what the current stock market valuation requires in 2021 and 2022.
Furthermore, the company’s earning power is 2x the corporate average level. Also, cash flows exceed total obligations. That said, intrinsic credit risk is just 40bps above the risk free rate. Together, these signal low credit and dividend risks.
To conclude, Lowe’s Uniform earnings growth is above peer averages, but the company is trading below peer average valuations.
Best regards,
Joel Litman & Rob Spivey
Chief Investment Strategist &
Director of Research
at Valens Research