
This investor’s focus on a unique economic theory helped position his fund to be prepared for the sell-off this year

This student of Reflexivity has taken 65+ years of financial market experience to master the idea of themes and macro investing. His theories help explain the wild swings we’ve seen recently and point to why he and his team were likely well-positioned for this disruption.
His thematic investing strategy doesn’t only prioritize fundamentals, but without a fundamental backing, his ideas likely wouldn’t perform as he expects. And yet, using GAAP as-reported financial metrics, the investments in his fund do not look primed to outperform from any event.
In reality, UAFRS-based financial metrics help make sense of the stocks he is buying, and how they line up perfectly.
In addition to examining the portfolio, we’re including a deeper look into the fund’s largest current holding, providing you with the current Uniform Accounting Performance and Valuation Tearsheet for that company.
Investor Essentials Daily:
Friday Uniform Portfolio Analytics
Powered by Valens Research
In times like the past 3 months, when the global market had its fastest and most dramatic onset of a bear market, and then one of its most aggressive relief rallies in history, arguing the market is efficient is a fool’s errand.
A combination of understanding investor psychology, broader behavioral economics, and market fundamentals, and how they all interact is necessary. Equally important is understanding how markets can bend significantly before they break, and then rebuild themselves.
George Soros has learned those lessons over a 65-year career in finance. It was using that same understanding of how and when markets are irrational, that they can build on their core beliefs, seeing confirmation bias and groupthink fuel markets in one direction.
Then inevitably, when the data becomes too impossible to ignore, the markets can react aggressively in the opposite direction, in an effort to normalize, which generally overshoots.
He has coined a term for this: Reflexivity. The focus of reflexivity is the feedback loops that occur in investor biases until they are broken.
His belief in this framework is what fueled his confidence in his trade to break the Bank of England in 1992, where he bet against the pound believing it was overvalued. He understood that investors’ belief that the Bank would stand behind the peg had caused the overvalued peg to become too extended. By pushing on it, he eventually broke it, causing a windfall.
The concept of reflexivity helps explain the set-up that occurred earlier this year.
As the news about the coronavirus worsened heading through January into February, equity markets continued to rocket higher. Investors willfully believed that nothing bad was going to come of the virus and that it was contained.
It was only when outbreaks occurred in Italy and South Korea that markets were forced to confront the reality that a massive aggressive shift occurred in the opposite direction, as Reflexivity kicked in.
Looking at Soros’ portfolio, it appears he and his team had already realized in December some of the issues that would occur, and were starting to focus on the “stay at home” winners that would appear.
The team’s focus on the likely thematic winners and losers is also not a surprise. The fund’s focus, applying Soros’ theory, is to identify thematic trends, and pick the likely winners of those trends and ride the trend until Reflexivity, again, rears its head.
This doesn’t just mean buying any company in a theme; it means buying companies that have that thematic benefit, but also other favorable fundamental characteristics.
That being said, analyzing Soros’ portfolio, it’s not obvious that the fund invests in either profitable or undervalued names using as-reported metrics.
We’ve conducted a portfolio audit of Soros’ top holdings, based on their most recent 13-F.
We’re showing a summarized and abbreviated analysis of how we work with institutional investors to analyze their portfolios.
Unsurprisingly, while as-reported metrics of Soros’ investments make it look like Soros has lost its way, in reality these investments appear to be higher quality names, once Uniform Accounting metrics are reviewed.
It’s clear that when Soros and his portfolio managers are making their investment decisions, they’re making decisions based on the real data.
See for yourself below.
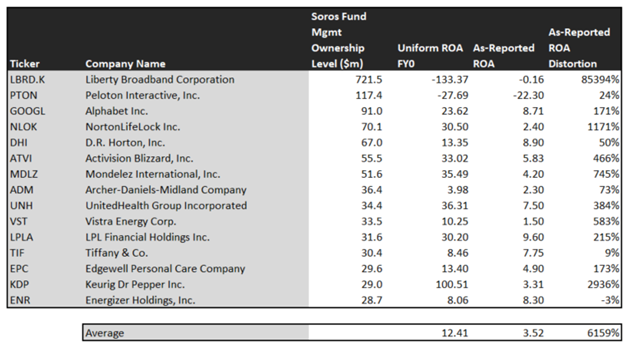
Using as-reported accounting, investors would think Soros has really focused on thematic investing, with no care about valuation or corporate fundamentals.
On an as-reported basis, many of these companies are poor performers with returns below 6%, and the average as-reported return on assets (ROA) is right at 3.5%.
In reality, the average company in the portfolio displays an impressive average Uniform ROA at 12%. That’s around corporate average returns currently.
Once we make Uniform Accounting (UAFRS) adjustments to accurately calculate earning power, we can see that the returns of the companies in Soros’ portfolio are much more robust.
Once the distortions from as-reported accounting are removed, we can realize that Alphabet (GOOGL) doesn’t have a 9% ROA, it is actually at 24%.
Similarly, Mondelez’ (MDLZ) ROA is really 35%, not 4%. While as-reported metrics are portraying the company as a low return business, Uniform Accounting shows the company’s real robust operations.
LPL Financial (LPLA) is another great example of as-reported metrics mis-representing the company’s profitability.
LPL doesn’t have a 10% ROA, it is actually at 30%. Soros appears to understand that market expectations for the company, thinking it’s a weak business, is completely incorrect.
The list goes on from there, for names ranging from DR Horton (DHI) and NortonLifeLock (NLOK), to Activision Blizzard (ATVI), UnitedHealth (UNH), and Keurig Dr Pepper (KDP).
If Soros were focused on as-reported metrics, it would never pick most of these companies because they look like anything but companies with big thematic tailwinds at their backs.
But to find companies that can deliver alpha beyond the market, just finding companies where as-reported metrics mis-represent a company’s real profitability is insufficient.
To really generate alpha, any investor also needs to identify where the market is significantly undervaluing the company’s potential.
Soros is also investing in companies that the market has low expectations for, low expectations the companies can exceed.
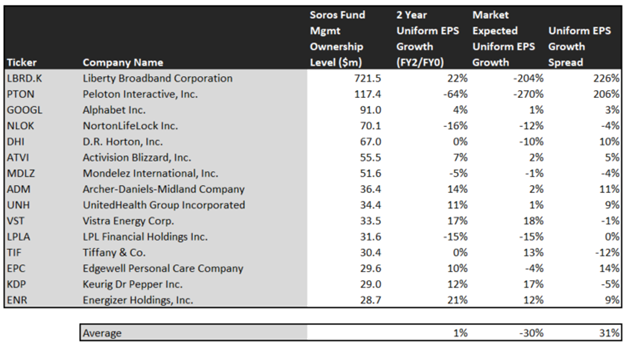
This chart shows three interesting data points:
- The 2-year Uniform EPS growth represents what Uniform earnings growth is forecast to be over the next two years. The EPS number used is the value of when we take consensus Wall Street estimates and we convert them to the Uniform Accounting framework.
- The market expected Uniform EPS growth is what the market thinks Uniform earnings growth is going to be for the next two years. Here, we show by how much the company needs to grow Uniform earnings in the next 2 years to justify the current stock price of the company. If you’ve been reading our daily analyses and reports for a while, you’ll be familiar with the term embedded expectations. This is the market’s embedded expectations for uniform earnings growth.
- The Uniform EPS growth spread is the spread between how much the company’s Uniform earnings could grow if the Uniform earnings estimates are right, and what the market expects Uniform earnings growth to be.
The average company in the US is forecast to have 5% annual Uniform Accounting earnings growth over the next 2 years. Soros’ holdings are forecast by analysts to grow less than that, growing at a modest 1% a year the next 2 years, on average.
But Soros may know something the market doesn’t, and is betting on fundamental tailwinds—tailwinds the market is not pricing in at all.
On average, the market is pricing these companies to shrink earnings by 30% a year. Even if these companies don’t grow more than 1% a year, they are fundamentally mispriced by 31% a year, and they may grow more.
These are the kinds of companies that are likely to see their stocks rally when the market realizes how wrong it is. Without Uniform numbers, the GAAP numbers would leave everyone confused. And the risk of returns collapsing is low, considering how high quality these companies are.
One example of a company in the Soros portfolio that has growth potential that the market is mispricing is DR Horton (DHI). DR Horton’s Wall Street analyst forecasts have 0% Uniform earnings growth built in, but the market is pricing the company to have earnings shrink by 10% each year for the next two years.
Another company with similar dislocations is Energizer Holdings (ENR). Expectations may look high with market expectations for 12% growth in earnings. However the company is actually forecast for Uniform EPS to grow by 21% a year. While expectations are high, if it can deliver higher growth, there’s more upside.
Yet another is Archer-Daniels-Midland (ADM), priced for 2% growth in Uniform earnings, when the company is forecast to grow by earnings by 14% a year.
That being said, there are a few companies we’d recommend Soros look at again before holding.
NortonLifeLock (NLOK) is forecast to see Uniform earnings shrink by 16% a year going forward. However, the market is pricing the company for only 12% annual earnings shrinkage.
This doesn’t look like an intrinsically undervalued company. If anything, the market looks significantly too bullish.
But many of Soros’ holdings look like a high quality, undervalued set of stocks with businesses displaying strong earning power. It wouldn’t be clear under GAAP, but unsurprisingly Uniform Accounting sees the same signals that Soros appears to.
Peloton Interactive, Inc. Tearsheet
As one of Soros’ largest individual stock holding, we’re highlighting Peloton Interactive, Inc. ‘s tearsheet today.
As our Uniform Accounting tearsheet for Peloton Interactive, Inc. (PTON:USA) highlights, Peleton’s Uniform P/E trades at -764.2x, which is below average valuation levels and historical average levels.
Low P/Es require low EPS growth to sustain them. In the case of Peloton, the company recently had a 291% Uniform EPS growth in 2019.
While Wall Street stock recommendations and valuations poorly track reality, Wall Street analysts have a strong grasp on near-term financial forecasts like revenue and earnings.
As such, we use Wall Street GAAP earnings estimates as a starting point for our Uniform earnings forecasts. When we do this, we can see that Peleton is forecast to see Uniform EPS shrinkage of 99% in 2020, followed by 79% EPS growth in 2021.
Based on current stock market valuations, we can back into the required earnings growth rate that would justify $43 per share. These are often referred to as market embedded expectations.
What Wall Street analysts expect for Peleton’s earnings growth is far above what the current stock market valuation requires.
Based on Uniform return on assets calculation, the company’s earning power is at -28%, which is below the corporate average. Furthermore, with cash flows and cash on hand consistently exceeding debt obligations, Peleton has low credit and dividend risk.
To conclude, Peleton’s Uniform earnings growth is far below peer averages, and is currently trading below peer averages.
Best regards,
Joel Litman & Rob Spivey
Chief Investment Strategist &
Director of Research
at Valens Research