
This one chart helps us understand refinancing risk and what it means for the economy in 2020 and 2021

As we’ve talked about before, credit cycles drive equity and economic cycles. If you can understand where credit markets are heading, you can understand what is likely to occur for the economy overall, and the equity markets.
Today we look at what credit markets are telling us about where the credit cycle is, and how that impacts our economic outlook.
Investor Essentials Daily:
The Monday Macro Report
Powered by Valens Research
Last year, we headlined our January Market Phase Cycle™ macro report: “A RECESSION IS COMING… in 18 months to two years if trends do not change before then.”
But then, as we expected might be the case…trends did change.
Many market strategists, financial journalists, and investors are calling for a recession in 2020.
Earlier this year, we wrote about the issues that really cause recessions. There’s no recession without a credit crunch. Credit crunches generally only happen because borrowers can’t refinance or retire debt that is maturing.
We pointed to 2021 or 2022 as being a perceived concern, as U.S. corporate obligations are forecast to begin to exceed cash flows. But we also highlighted that if debt maturities get refinanced and deferred, then the window for economic growth could extend longer.
We’re in the midst of 10-K season, where we’ll find out on an aggregate basis how much that debt has been pushed off. But anecdotally, we’ve already seen that refinancing happening in the past 12 months.
That wasn’t happening in 2018 or early in 2019…
There’s a simple reason we’re seeing a renewed surge of refinancing…
After rising massively in 2018, the costs for corporations to borrow have fallen.
We look at the credit default swap (“CDS”) as a good proxy for how much it costs corporations to borrow. A CDS is a contract that acts like insurance for bonds. If a company can’t pay its debts, a CDS insures that the owner of the debt gets paid.
Much like Auto and property insurance, the higher the risk, the more expensive it costs to insure. In times of elevated credit risk, CDS skyrockets in price.
Leading up to the Great Recession, investor interest in the CDS market rose massively, until the market grew to $62 trillion. Much like trying to purchase insurance midway through a car crash, it became impossible to insure corporate credit at a reasonable price…
The “price” of a CDS roughly matches the cost of a company to borrow, above the cost for the U.S. government to borrow – the risk-free rate (“RFR”).
If we add together the risk-free rate and a company’s CDS, we can understand how much the all-in cost is for a company to borrow money. And if we add up that number for all the companies that have CDSs, we can understand how much it costs in aggregate for corporations to borrow.
The chart below highlights CDS prices plus the RFR over the last decade. CDSs are broken into three buckets: investment grade (“IG”), crossover (“XO”), and high yield (“HY”).
IG companies are the largest, safest, and most stable public companies, while HY companies are the smallest and riskiest. So it makes sense that HY CDSs are always more expensive than IG ones, and XO CDSs are always in the middle.
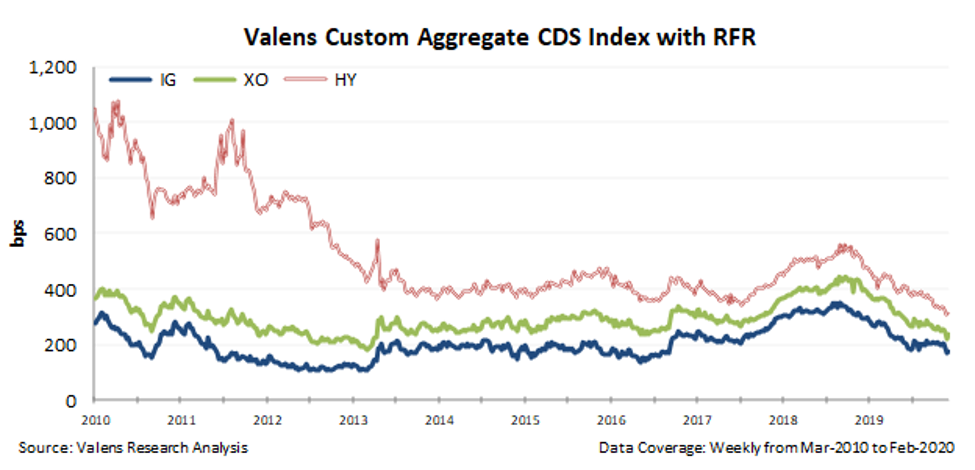
The cost to borrow for all types of credits is significantly lower today than it was in 2010, as we were exiting the Great Recession.
Companies have used lower costs to consistently refinance their debt maturities, and raise more debt. It made sense. When companies “roll” their debt this way, they get to delay repaying it and also see interest expenses decline or, at worst, stay flat. Lower interest expense means net income rises.
But in 2018, something changed; the refinancing market dried up. Companies weren’t as active refinancing their debts.
The reason? The cost to do refinance had risen significantly, for a few reasons.
First, the Federal Reserve was actively hiking interest rates, with four rate increases in 2018.
And the underlying CDSs for corporate borrowers were rising too. Investors were beginning to grow concerned the bull market was coming to an end.
The cost to borrow for IG companies rose from around 2% to 3.5% in 2018 through early 2019. The cost to borrow for HY businesses jumped from 3.5% to 5.5%.
Companies saw these interest-rate increases and paused stopped refinancing. That’s how the debt-maturity headwall in 2021 that we highlighted earlier this year got so big.
But in recent months, we’ve seen a big inflection that caused the refinancing market to return. It’s why we think debt-maturity headwalls that had been looking material for 2021 are likely to be pushed out to 2022 and beyond.
That is important, as without debt-maturity headwalls in 2021, there’s no risk of a recession.
The rise in the cost to borrow in 2018 has completely reversed itself. Thanks to the Fed cutting rates and market perception of corporate credit risk moderating, cost to borrow is in line with, or even lower than, what it was in 2014 through 2017, when the refinancing market was strong.
As importantly, the fundamentals confirm the market move.
Market CDS metrics are driven by investor demand, which is driven by how credit looks based on as-reported accounting figures.
Once we apply Uniform Accounting metrics, we can calculate what credit risk really is for a company. We call this metric “intrinsic CDS,” or iCDS. The intrinsic credit risk companies are facing is even lower than CDSs show you…

Our iCDS takes into account the real risk factors impacting each bucket of companies to understand what their real cost to borrow should be, based on that risk.
As you can see, the less volatile companies (IG and XO) look more or less the same. These buckets have less volatility to begin with. However, looking at the riskiest group of companies (HY), something jumps out…
The market is overstating credit risk for HY companies.
We already know that the risk of a recession is much lower than many on Wall Street are claiming, just by understanding how important the refinancing market is to economic growth.
But using Uniform Accounting, we can see even more… Not only is the risk of a recession overstated, the actual risk of HY corporates – the highest-risk businesses – is even lower than the market realizes. As the market adjusts to this reality, it will give even more tailwinds to the refinancing cycle, extending out the risk of a recession to 2022 – if not even further.
All the best, as always,
Joel Litman & Rob Spivey
Chief Investment Strategist &
Director of Research
at Valens Research