
This Principles-driven fund manager is as tight-lipped about his process as the CIA – Uniform Accounting offers a window into his black-box

When the most secretive organizations in the world decide to publish their data, it often draws a lot of attention.
This fund may not be the CIA or the NSA, but in the investment world, it’s viewed as being as tight-lipped.
However, the firm’s daily newsletter service often helps draw the most attention to the company’s quantitative strategy success.
We look at how this quant fund’s strategy generates signals that line up quite strongly with Uniform Accounting (UAFRS) signals.
The results are unsurprising. Using GAAP as-reported financial metrics, the investments in this fund’s portfolio look like someone made some significant mistakes in their process.
In reality, UAFRS-based financial metrics show how this alpha-focused investment machine buys stocks with very attractive upside signals.
In addition to examining the portfolio, we’re including a deeper look into the fund’s largest current holding, providing you with the current Uniform Accounting Performance and Valuation Tearsheet for that company.
Investor Essentials Daily:
Friday Uniform Portfolio Analytics
Powered by Valens Research
The CIA is one of the most secretive organizations in the world. It is often said that if you live in the Washington DC area, you could spend your entire life with a neighbor in the CIA and have no idea until they retire, if you ever find out.
And yet, if you’ve ever had to do any sort of macro research, especially about country GDP, population, core industries, etc, you’ve experienced how open the CIA really is.
The CIA Worldbook is one of the most comprehensive public datasets on this type of data available globally.
When many people think of secretive organizations, they think of the CIA, the NSA, British MI6, or the Russian FSB. But in Wall Street, there’s another organization that’s known for being just as secretive.
Ray Dalio’s Bridgewater Associates is the largest hedge fund in the world, with $160 billion in assets under management. And yet, it is said that Dalio keeps the process by which the fund’s assets are managed locked away.
Much like how the CIA or NSA operate on a need-to-know basis, few people even within the organization even have a window into how Bridgewater manages clients’ money and executes the firm’s strategies.
Bridgewater’s campus itself is also highly secure. The company rarely lets outsiders on campus or photography or filming to occur, outside of the filming the company does of its employees interactions itself.
But even with how secretive Bridgewater is, like the CIA’s Worldbook, it has insights it publishes that users crave.
Dalio started writing Daily Observations in the early 1980s as a subscription research report, focused on currency and interest rate insights. Over time, the product has evolved. It’s no longer generally written by Dalio and can cover any number of investment related insights. But the quality of the insights remains robust.
When a Daily Observation makes it out to the public, investors generally dive deeply into it immediately. It’s widely respected within the industry as thoughtful research that often has prescient insights.
Many of the investment dailies that are published through today, from those by John Mauldin to those written by investment banks, and even this, can trace some of their history back to Dalio’s original decision to publish the Daily Observations, and how clients engaged with Bridgewater.
The Daily Observations are often focused on macro or big picture topics for investors. Much like our Market Phase Cycle™ helps us frame the type of ideas we identify for investors.
Like our rigorous research on the past 150 years of market cycles and beyond, Dalio and Bridgewater deeply study economic cycles and signals to identify when there are investment opportunities and signals that investors focusing on shorter-term moves in the market and individual stocks are missing.
Bridgewater is different from many of the funds we’ve highlighted in our daily. From Berkshire Hathaway to Baupost and First Eagle as value investors, or Driehaus as a growth investor, or Tiger Global as a deep fundamental and thematic investor, all the investors we’ve analyzed previously have been stock pickers. Bridgewater runs quantitative, or quant, strategies.
Bridgewater’s analysts aren’t actively picking stocks. The firm uses quantitative strategies based on their analysts’ research to identify stocks, ETFs, and other assets to buy and sell under the company’s Pure Alpha and All Weather funds.
Unsurprisingly, because of the hedged strategies Bridgewater’s funds operate under, the largest holdings are ETFs, so Bridgewater can get market return profiles. Those are likely hedged with shorts, which the fund doesn’t have to disclose.
Looking at Bridgewater’s ETF portfolio isn’t particularly insightful. However, looking at the stocks the process identifies to generate alpha is.
While analysts and PMs aren’t actively picking stocks, for the company’s strategy, the stocks the funds own still need to produce strong performance for the firm to generate good returns. It is an interesting exercise to see if Uniform Accounting lines up with the quantitative strategies Bridgewater is using.
We’ve conducted a portfolio audit of Bridgewater’s top holdings, based on their most recent 13-F, this time focusing on their non-financial company and non-ETF holdings.
We’re showing a summarized and abbreviated analysis of how we work with institutional investors to analyze their portfolios.
Unsurprisingly, for the most part, Bridgewater’s analytics appear to be steering the portfolio to companies that Uniform Accounting metrics highlight are much higher quality, and have higher potential, than the market and as-reported metrics imply.
Because Uniform Accounting metrics do a better job of identifying real corporate performance than as-reported distorted metrics do, UAFRS is more likely to identify candidates to generate alpha. Even though Bridgewater is coming at identifying those companies from a very different direction, their process is unsurprisingly identifying the same signals UAFRS does.
See for yourself below.
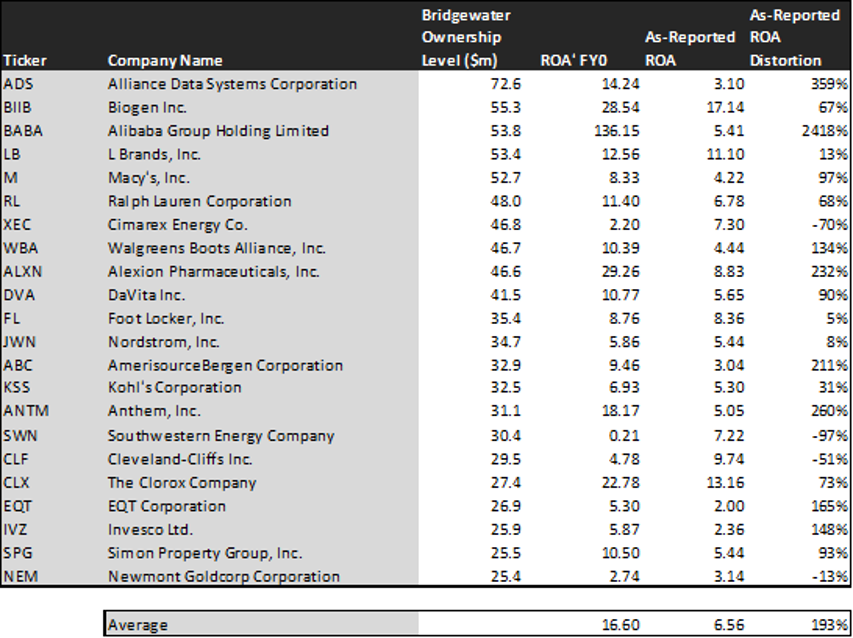
Using as-reported accounting, investors would be scratching their heads at some of the companies that Bridgewater owns.
The average company in the portfolio displays an impressive average Uniform return on assets (ROA) at 17%. That’s well above corporate average returns currently. On an as-reported basis, many of these companies are poor performers with returns below 5%-6%, and the average as-reported ROA is only 7%.
On an as-reported financial metric basis, it would appear that Bridgewater was identifying poorly performing firms, and hoping they would rebound.
While we’re not primed for a recession, as we highlighted last week in the Investor Essentials, we’re also not early in a cycle, when turnarounds are a great investment candidate. Investors might think Bridgewater is wrongly positioned.
However, once we make Uniform Accounting (UAFRS) adjustments to accurately calculate earning power, we can see that the returns of the companies in Bridgewater’s portfolio are much more robust.
In fact, looking at the companies that Bridgewater is buying on a Uniform basis, it’s clear it is buying companies with strong economic moats that will keep on performing well in this mid-to-late cycle environment.
Once the distortions from as-reported accounting are removed, we can realize that Alibaba (BABA) doesn’t have a 5% ROA, it is actually at 136%. Alibaba is a world-beating company that is both growing and producing impressive profitability for shareholders.
Similarly, Alexion Pharmaceuticals’ (ALXN) ROA is really 29%, not 9%. While fundamental investors are overly punishing the company for some near-term execution issues, Bridgewater’s quantitative strategy sees its strong profitability and visibility of earning power.
Anthem (ANTM) is another great example of as-reported metrics mis-representing the company’s profitability. If Bridgewater’s model was powered by that data, it wouldn’t be identifying the company’s strong fundamentals.
Anthem doesn’t have a 5% ROA, it is actually at 18%. Bridgewater’s system appears to understand that market expectations for the company, related to Medicare For All overhang concerns, is overblown, and the company’s real fundamentals are strong enough to warrant upside.
The list goes on from there, for names ranging from Davita (DVA) and AmerisourceBergan (ABC), to EQT (EQT), Invesco (IVZ), and Simon Properties (SPG).
If Bridgewater’s system was powered by as-reported metrics, it would never pick most of these companies, because they look like bad companies, and poor investments.
But to find companies that can deliver alpha beyond the market, just finding companies where as-reported metrics mis-represent a company’s real profitability is insufficient.
To really generate alpha, any investor also needs to identify where the market is significantly undervaluing the company’s potential.
Bridgewater is also investing in companies that the market has low expectations for, low expectations the companies can exceed.

This chart shows three interesting data points:
– The first datapoint is what uniform earnings growth is forecast to be over the next two years, when we take consensus Wall Street estimates and we convert them to the Uniform Accounting framework. This represents the uniform earnings growth the company is likely to have, the next two years
– The second datapoint is what the market thinks uniform earnings growth is going to be for the next two years. Here, we are showing how much the company needs to grow uniform earnings by in the next 2 years to justify the current stock price of the company. If you’ve been reading our daily and our reports for a while, you’ll be familiar with the term embedded expectations. This is the market’s embedded expectations for uniform earnings growth
– The final datapoint is the spread between how much the company’s uniform earnings could grow if the Uniform Accounting adjusted earnings estimates are right, and what the market expects uniform earnings growth to be
The average company in the US is forecast to have 5% annual Uniform Accounting earnings growth over the next 2 years. Bridgewater’s holdings are forecast by analysts to outpace that, growing at a robust 36% a year the next 2 years, on average.
Bridgewater’s system is not just finding high quality companies, it is finding mispriced companies.
On average, the market is pricing these companies to actually shrink earnings by 1% a year. While these companies are growing robustly, they are intrinsically undervalued, as the market is mispricing their growth by 37% on average.
Even when looking at median levels, the market is mispricing these companies earnings growth by 12%.
These are the kinds of companies that are likely to see their stocks rally when the market realizes how wrong it is. Without Uniform numbers, the GAAP numbers would leave everyone confused.
One example of a company in the Bridgewater portfolio that has growth potential that the market is mispricing is Biogen (BIIB). Biogen’s analyst forecasts have 10% Uniform earnings growth built in, but the market is pricing the company to have earnings shrink by 13% earnings each year for the next two years.
Another company with similar dislocations is Newmont (NEM). Expectations may look high with market expectations for a 23% growth in earnings. However the company is actually forecast for Uniform EPS to grow by 56% a year. While expectations are high, if it can deliver higher growth, there’s more upside.
Yet another is the fund’s largest holding, Alliance Data Systems (ADS), is priced for a 10% decline in uniform earnings, when they are forecast to grow by earnings by 2% a year.
Unsurprising considering the quantitative nature of the strategy, there are very few companies in the portfolio that look misplaced in this strategy. Only one name appears to have a significantly negative dislocation between what the market is pricing in and what is forecast
Invesco (IVZ) is forecast to see Uniform earnings shrink by 4% a year going forward, however the market is pricing the company for 7% annual earnings growth.
This doesn’t look like an intrinsically undervalued company. If anything, the market looks significantly too bullish.
But for the most part, Bridgewater’s quantitative portfolio looks like a high quality, undervalued set of stocks with businesses displaying strong earning power. It wouldn’t be clear under GAAP, but unsurprisingly Uniform Accounting and a system built to deliver alpha see the same signals.
Alliance Data Systems Tearsheet
As Bridgewater’s largest individual stock holding, we’re highlighting Alliance Data System’s tearsheet today.
As our Uniform Accounting tearsheet for Alliance Data Systems highlights, ADS trades below market average valuations. The company has recently had robust 26% Uniform EPS growth. EPS growth is forecast to shrink by 35% in 2019, but rebound strongly at 61% in 2020.
At current valuations, the market is pricing the company to see earnings shrink by 10% a year going forward, clearly seeing the 2019 decline for the company, but not recognizing the potential strong rebound.
The company’s earnings growth is forecast to be well below peer averages for next year, but the company also trades at a significant discount to peer average valuations. The company has healthy returns, but does have cash flow risk to their dividend. Check out the tearsheet to see a lot more.
Best regards,
Joel Litman & Rob Spivey
Chief Investment Strategist &
Director of Research
at Valens Research