
This simple recession indicator is flashing bullish for the stock market

Over the past month, rates have swung wildly in both directions. Thanks to investor sentiment about inflation balanced with fears of hard times, rates are struggling to find an equilibrium point.
Today, we talk about what drives rates and what effect they will have on equity markets. By leveraging the yield curve, we can see what it says about an upcoming recession.
Investor Essentials Daily:
The Monday Macro Report
Powered by Valens Research
Back in late January, 10-year treasury notes fell from 1.145% to 1.016%, a sharp contrast to the steady climb over the past six months.
Treasury notes serve as an indicator of investor sentiment for the future. Investing in the United States is effectively riskless, so treasury yields are viewed as a representation of the risk-free rate, and as it rises and falls it can tell investors a few important things.
Rates rising generally are a signal of one of two things, either that investors are worried about inflation, or that investors are more bullish about the economy. When rates go down, it is a sign investors are afraid of hard times, and are buying the safest asset they can get their hands on, US government debt.
The reason rates fell in January is because Janet Yellen, the former Fed chair, testified to Congress the 2017 tax cuts should be repealed.
However, this slide has reversed impressively through February. 10-year treasuries rates climbed to nearly 1.4% late last week, the highest level since February 2020. That’s up from 0.92% to close 2020. An impressive rally.
This move has been an inverse of the January fall, investors are starting to grow more concerned about inflationary pressures.
This came to the forefront with the Federal Reserve Open Markets Committee (FOMC) signaling last week that its members are comfortable with higher inflation for longer, to help boost job growth. This, along with Biden’s upcoming $1.9 trillion spending plan, promises more gas to the economy.
While inflation may be creeping into investors’ minds, there’s a far more important reason economic watchers should monitor treasury yields.
In aggregate treasury yields make up the yield curve, a favorite tool among economists and policymakers.
To understand what the yield curve is saying about the economy, we shouldn’t just look at treasuries that mature at one point in the future. Instead, we can chart out the yield along different time horizons.
The yield curve is one surefire signal a recession is coming, or more importantly right now, is not coming.
As we mentioned above, treasury yields are a good window of market expectations for economic growth in the future. Looking at yields for different time frames such as those which mature in 3 months, in 2 years, in 5 years, and in 10 years can give a window for if investors expect economic growth to get stronger over time, or weaker.
When long-term interest rates are higher than short-term interest rates, it is a “positive” yield curve. This signals that investors expect economic growth to build on itself in the future.
On the other hand, an inverted yield curve is a warning sign for investors. This means the market is expecting that at some point in the future, growth is going to slow down significantly.
In the past 70 years, an inverted yield curve has always signaled a recession, using two yields as 3 month and the 10 year treasury bond yields the benchmark.
While the signal is rooted in fundamentals, one reason why it works is because market concerns become a self-fulfilling prophecy in the real economy.
Banks borrow in the short-term and lend in the long-term. If long-term rates fall to low levels relative to short-term rates, they don’t make money. Even with the mark-up they have when they are lending to others, when adjusted for costs, they are effectively lending at lower rates than they are borrowing.
It doesn’t make economic sense for them to be actively making loans. If the banks then don’t extend loans to companies who need the money to pay back debt coming due, troubles arise.
As we have talked about before, recessions are sparked by a credit crunch.
What is the yield curve saying now?
As you can see below, the yield curve briefly flipped negative in 2019, indicating investors were concerned about a recession. Those concerns proved prescient.
However, as the Fed has injected capital into the economy, the yield curve has grown progressively more positive through late 2020 and into 2021.
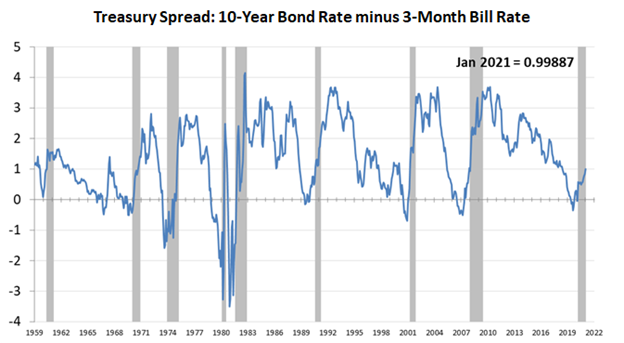
While some analysts are worried about inflation and the 10-year treasury yield, this chart should ease any concerns over economic growth.
The FOMC has signaled its desire to keep short-term yields low and the yield curve positive, which will help push banks to continue lending, and will help the economy grow.
So no matter how rocky the market gets in the near-term because of inflation, valuations, or growth expectations, the market won’t be primed for another bear market and the economy won’t be primed for another recession.
Because with a positive yield curve, the spigots of the economy are open, and a positive economic cycle is in the forecast.
Best regards,
Joel Litman & Rob Spivey
Chief Investment Strategist &
Director of Research
at Valens Research


