
Today’s fund is a pioneer in arbitrage investing, Uniform Accounting shows the fund hasn’t missed a step

Hedge funds employ a variety of investing strategies to take advantage of market inefficiencies. One of the most popular is arbitrage investing, where investors look for relative mispricings between similar assets.
Today’s fund has been a pioneer of arbitrage strategies, and has been employing similar techniques for over 30 years.
In addition to examining the portfolio, we are including a deeper look into the fund’s largest current holding, providing you with the current Uniform Accounting Performance and Valuation Tearsheet for that company.
Investor Essentials Daily:
Friday Uniform Portfolio Analytics
Powered by Valens Research
Arbitrage is just a fancy way to say an investor is finding two assets that are mispriced relative to each other, and then holding until the values converge. If one asset is priced too high relative to another, you can place a trade benefiting if the more expensive assets slips, or the cheaper asset rises. It is essentially a way to take advantage of inefficient markets by betting on the price differences between similar assets.
Hedge funds have popularized many different forms of arbitrage. An example is convertible arbitrage, where investors can trade convertible bonds against the equity of the company.
Typically an investor will buy a convertible, and short the underlying stock to capitalize on mispricing between the convertible and stock. The bet is at some point the convertible note can convert to equity, so eventually the two assets will converge on pricing.
There is also classic relative value arbitrage. This is when you find a company in an industry trading very cheaply relative to a peer in the same industry, and you go long the cheap stock and short the other. The bet is that two companies in the same industry with similar macro trends should trade at similar valuations. Thus, over time the stocks should converge in value towards historical means with the cheap stock appreciating and more expensive stock reverting to averages.
Finally, merger arbitrage is another popular form of investing. It is built off of academic research that shows acquisitions tend to destroy value. In fact, it is estimated that more than 60% of mergers and acquisitions (M&A) actually hurt value.
If acquisitions destroy value for the acquirer, it is likely the acquirer’s stock will thus drop as an acquisition approaches. At the same time, the acquired company’s stock, assuming the deal will close, has little downside if it is an all cash bid. Equity bids have the downside of having the stock drop being captured in the acquirers stock.
Therefore, an investor can go long the stock of the company being acquired, and short the company acquiring, and just wait to take on the spread between them. Like other forms of arbitrage, it seeks to take advantage of market inefficiencies, this time related to M&A. Our director of research Rob used to work at a hedge fund called The Abernathy Group, who were successful as innovators of this strategy in the 1980s and 1990s.
Davidson Kempner, one of the world’s largest hedge funds, focuses on these types of arbitrage strategies, along with distressed asset investing and more traditional long/short strategies. Davidson Kempner currently has $34 billion in assets under management and has been in business for over 37 years.
When looking at the fund’s current holdings, it is crucial to use Uniform Accounting to see what Davidson Kempner is seeing.
Using only as-reported metrics, it would appear Davidson Kempner is buying sub-par companies under distress. While that might make sense for the distressed asset strategy for the fund, it doesn’t make sense for the fund’s other strategies. This might make investors wonder what Davidson Kempner is thinking with its investments.
In reality, it isn’t buying poor performing businesses, but firms with robust returns.
See for yourself below.
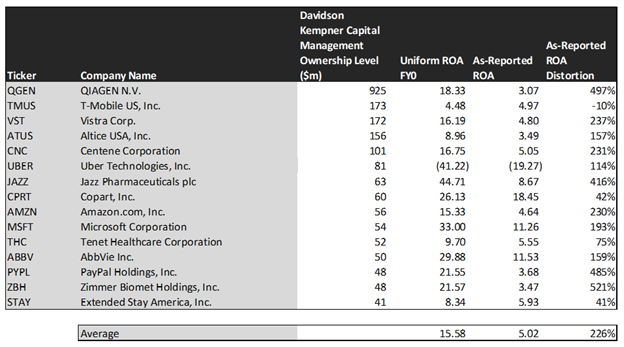
Using as-reported accounting, investors would think Davidson Kempner Capital is arbitrarily picking stocks with low returns that are distressed.
On an as-reported basis, many of these companies are poor performers with returns below 10%, with the average as-reported return on assets (ROA) right around 5%.
In reality, the average company in the index displays an impressive average Uniform ROA of 16%.
Once we make Uniform Accounting (UAFRS) adjustments to accurately calculate earnings power, we can see the underlying strength of Davidson Kempner’s picks. Once the distortions from as-reported accounting are removed, we can see that QIAGEN (QGEN) does not have an average return of 3%, but a sizable ROA of 18%.
Similarly, Vistra’s (VST) ROA is really 16%, not at 5%. While as-reported metrics are portraying the company as a business below cost of capital, Uniform Accounting shows the company’s truly robust operations.
Zimmer Biomet (ZBH) is another great example of as-reported metrics misrepresenting the company’s profitability. It doesn’t have a 3% ROA, it is actually at 22%.
The list goes on from there, for names ranging from Microsoft (MSFT) and Amazon (AMZN), to PayPal (PYPL), Centene (CNC), and AbbVie (ABBV).
If investors were to only look at as-reported metrics, they would assume Davidson Kempner is embracing low-return business under distress. Rather, the fund is making smart investments to compound returns.
Now, let us see how these firms’ returns can strengthen over time through EPS growth.

This chart shows three interesting data points:
- The 2-year Uniform EPS growth represents what Uniform earnings growth is forecast to be over the next two years. The EPS number used is the value of when we take consensus Wall Street estimates and we convert them to the Uniform Accounting framework.
- The market expected Uniform EPS growth is what the market thinks Uniform earnings growth is going to be for the next two years. Here, we show by how much the company needs to grow Uniform earnings in the next 2 years to justify the current stock price of the company. If you’ve been reading our daily analyses and reports for a while, you’ll be familiar with the term embedded expectations. This is the market’s embedded expectations for Uniform earnings growth.
- The Uniform EPS growth spread is the spread between how much the company’s Uniform earnings could grow if the Uniform earnings estimates are right, and what the market expects Uniform earnings growth to be.
The average company in the U.S. is forecast to have 5% annual Uniform Accounting earnings growth over the next 2 years. Davidson Kempner’s estimated EPS growth is forecasted at 8%.
The market is less optimistic, pricing these companies for -10% growth.
One example of a company with high growth potential is AbbVie. While the market expects AbbVie to shrink by 8% over the next two years, analysts forecast the firm to see a 13% growth over the same period.
Another company with similar dislocations is Centene. The company is forecast for Uniform EPS to grow by 18% a year, and the market is expecting the company to in fact shrink by 1%.
Yet another example is Altice (ATUS). The company is cheap, as it is priced for just 1% growth in Uniform earnings, but the company is forecast to in fact grow its EPS by 63% in the next two years.
That being said, there are some companies forecasted to have earnings growth less than market expectations. For these companies, like T-Mobile (TMUS), Copart (CPRT), and PayPal, the market has growth expectations in excess of analysts’ predictions.
In conclusion, Davidson Kempner has seen sustained success taking advantage of arbitrage strategies and other smart trades over the years. Its diversified strategies are still in use today, and the firm continues to create value for investors with smart picks, as seen with Uniform Accounting.
SUMMARY and QIAGEN N.V. Tearsheet
As Davidson Kempner Capital Management’s largest individual stock holding, we’re highlighting QIAGEN N.V.’s tearsheet today.
As the Uniform Accounting tearsheet for QIAGEN highlights, the Uniform P/E trades at 20.0x, which is below corporate average valuation levels but around its historical average valuations.
Low P/Es require low EPS growth to sustain them. In the case of QIAGEN, the company has recently shown a 28% Uniform EPS growth.
Wall Street analysts provide stock and valuation recommendations that in general provide very poor guidance or insight. However, Wall Street analysts’ near-term earnings forecasts tend to have relevant information.
We take Wall Street forecasts for GAAP earnings and convert them to Uniform earnings forecasts. When we do this, QIAGEN’s Wall Street analyst-driven forecast is a 19% growth into 2020 and a 21% growth into 2021.
Based on current stock market valuations, we can use earnings growth valuation metrics to back into the required growth rate to justify QIAGEN’s $48 stock price. These are often referred to as market embedded expectations.
The company needs to grow its Uniform earnings by 2% each year over the next three years and to justify current stock prices. What Wall Street analysts expect for Match Group’s earnings growth is above what the current stock market valuation requires in 2020 and 2021.
Furthermore, the company’s earning power is 3x the corporate average. Also, cash flows are significantly above their total obligations—including debt maturities, capex maintenance, and dividends. However, QIAGEN intrinsic credit risk is 130bps above the risk free rate. Together, this signals a moderate credit risk and dividend risk.
To conclude, QIAGEN’s Uniform earnings growth is above peer averages in 2020. However, the company is also trading above average peer valuations.
Best regards,
Joel Litman & Rob Spivey
Chief Investment Strategist &
Director of Research
at Valens Research