
Today’s fund is a pioneer in the hedge fund sector, Uniform Accounting shows the fund hasn’t lost its touch

In the past, hedge funds would invest almost exclusively for high net-worth individuals. Today, a large portion of invested capital in hedge funds comes from endowments and pension funds.
Today’s fund helped pioneer these developments back in the 1980s. It brought institutional money to the industry, and helped drive high returns for the fund that still continues today.
In addition to examining the portfolio, we are including a deeper look into the fund’s largest current holding, providing you with the current Uniform Accounting Performance and Valuation Tearsheet for that company.
Investor Essentials Daily:
Friday Uniform Portfolio Analytics
Powered by Valens Research
Tom Steyer is probably most famous at this point for his failed 2020 presidential run, in which he dropped out shortly after the South Carolina primary. However, he first came to prominence as the founder of successful hedge fund Farallon Capital.
Steyer got his start in the late 1970s at Morgan Stanley (MS) before moving on to Stanford Business School, and then the risk arbitrage division at Goldman Sachs (GS). Steyer left the lucrative waters of investment banks to start his own hedge fund in 1986, Farallon Capital.
Farallon Capital changed the game for hedge funds. It made a name for itself by being one of the first hedge funds to raise money from university endowments. Previously, hedge funds had invested almost exclusively for high net-worth individuals.
Steyer approached Yale University, his undergraduate alma mater, to give his new fund money to manage. The Yale Endowment initially declined due to the high-fees in the hedge fund industry.
However, the Yale Endowment eventually came to an agreement in which Steyer would initially manage the funds for free. After the investment proved to be a success, the endowment began paying fees to Farallon Capital.
This began the influx of endowment and pension funds into the hedge fund industry. No longer did only rich businessmen have access to these investing vehicles.
Farallon also claims to be the primary creator of absolute return investing. Absolute returns are expressed as a percentage of invested capital and generally do not have benchmarks.
Farallon invested in a variety of different asset classes using multiple strategies. It was known for event driven investing, where the fund would help distressed companies restructure as a stakeholder. For example, Farallon invested in an Argentinian shoe company and stabilized its profits as Argentina recovered from an economic crisis.
Other strategies involved merger arbitrage, real-estate investments, credit investments, and emerging markets.
In 2002, Farallon invested in an Indonesian bank called Bank Central Asia (BCA). With many Indonesian firms on the verge of collapse, Farallon helped steer it through tough times and sold for a profit in 2006. Huge investments into Indonesia by other funds followed, highlighting Farallon’s pioneering nature.
Its many diversified strategies have been a great fit for the wide ranging needs of endowment and pension funds.
Steyer eventually left the fund in 2012 to pursue his political interests, but not before leaving a mark on the hedge fund industry. He even led the fund to divest from its carbon-polluting investments, and focused more on alternative sources during his departure.
Farallon Capital has maintained much of the same strategy it employed during the Steyer years. The firm still focuses on merger arbitrage and buying assets that might be under distress looking for upside.
However, it is crucial to use Uniform Accounting when analyzing this fund’s current holdings to see what Farallon is seeing.
Using only as-reported metrics, it would appear Farallon Capital is buying sub-par companies with low returns and high market expectations. While that might make sense for the distressed asset strategy for the fund, it doesn’t make sense for the fund’s other strategies. That might make investors wonder what Farallon is thinking with its investments.
In reality, it isn’t buying poor performing businesses, the companies it is buying are quite robust.
See for yourself below.
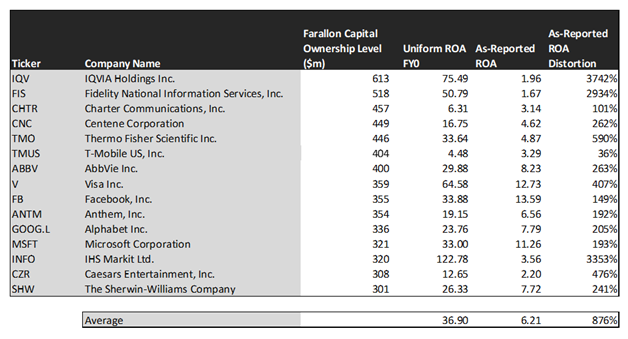
Using as-reported accounting, investors would think Farallon Capital is arbitrarily picking stocks with low returns that are distressed.
On an as-reported basis, many of these companies are poor performers with returns below 10% or below, with the average as-reported return on assets (ROA) right around 6%.
In reality, the average company in the index displays an impressive average Uniform ROA of 37%.
Once we make Uniform Accounting (UAFRS) adjustments to accurately calculate earnings power, we can see the underlying strength of Farallon Capital’s picks.
Once the distortions from as-reported accounting are removed, we can see that IQVIA (IQV) does not have negligible return of 2%, but a sizable ROA of 75%.
Similarly, Thermo Fisher Scientific’s (TMO) ROA is really 34%, not at 5%. While as-reported metrics are portraying the company as a business below cost of capital, Uniform Accounting shows the company’s truly robust operations.
IHS Markit (INFO) is another great example of as-reported metrics misrepresenting the company’s profitability. It doesn’t have a 4% ROA, it is actually at 123%.
The list goes on from there, for names ranging from Microsoft (MSFT) and Centene (CNC), to Facebook (FB), Fidelity (FIS), and AbbVie (ABBV).
If investors were to only look at as-reported metrics, they would assume Farallon is embracing low-return business under distress. Rather, the fund is making smart investments to compound returns.
Now, let us see how these firms’ returns can strengthen over time through EPS growth.
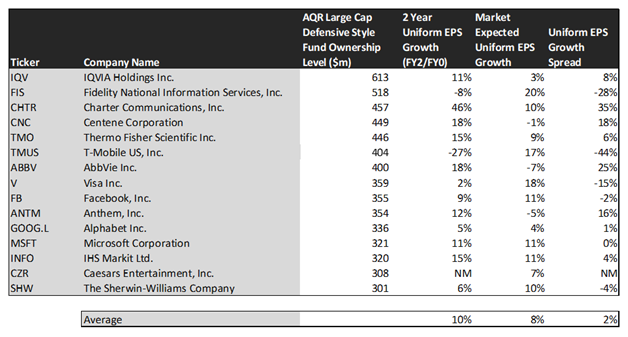
This chart shows three interesting data points:
- The 2-year Uniform EPS growth represents what Uniform earnings growth is forecast to be over the next two years. The EPS number used is the value of when we take consensus Wall Street estimates and we convert them to the Uniform Accounting framework.
- The market expected Uniform EPS growth is what the market thinks Uniform earnings growth is going to be for the next two years. Here, we show by how much the company needs to grow Uniform earnings in the next 2 years to justify the current stock price of the company. If you’ve been reading our daily analyses and reports for a while, you’ll be familiar with the term embedded expectations. This is the market’s embedded expectations for Uniform earnings growth.
- The Uniform EPS growth spread is the spread between how much the company’s Uniform earnings could grow if the Uniform earnings estimates are right, and what the market expects Uniform earnings growth to be.
The average company in the U.S. is forecast to have 5% annual Uniform Accounting earnings growth over the next 2 years. Farallon Capital’s estimated EPS growth is forecasted at 10%.
The market is less optimistic, pricing these companies for 8% growth.
One example of a company with high growth potential is AbbVie. While the market expects AbbVie to shrink by 7% over the next two years, analysts forecast the firm to see a 18% growth over the same period.
Another company with similar dislocations is Centene. The company is forecast for Uniform EPS to grow by 18% a year, and the market is expecting the company to in fact shrink by 1%.
Yet another example is Charter Communications (CHTR). The company is cheap, as it is priced for just 10% growth in Uniform earnings, but the company is forecast to in fact grow its EPS by 46% in the next two years.
That being said, there are some companies that are forecast to have earnings growth less than market expectations. For these companies, like T-Mobile (TMUS), Sherwin-Williams (SHW), and Fidelity, the market has growth expectations in excess of analysts’ predictions.
In conclusion, Farallon Capital has been a pioneer in the hedge fund industry in many ways. It brought endowments and pension funds to the industry, as well as pioneering absolute return investing. Its diversified strategies are still in use today, and the firm continues to create value for investors with smart picks, as seen with Uniform Accounting.
SUMMARY and Fidelity National Information Services, Inc. Tearsheet
As Farallon Capital’s second largest individual stock holding, we’re highlighting Fidelity’s tearsheet today.
As the Uniform Accounting tearsheet for Fidelity highlights, the Uniform P/E trades at 38.7x, which is above corporate average valuation levels and its historical average valuations.
High P/Es require high EPS growth to sustain them. In the case of Fidelity, the company has recently shown a 10% Uniform EPS growth.
Wall Street analysts provide stock and valuation recommendations that in general provide very poor guidance or insight. However, Wall Street analysts’ near-term earnings forecasts tend to have relevant information.
We take Wall Street forecasts for GAAP earnings and convert them to Uniform earnings forecasts. When we do this, Fidelity’s Wall Street analyst-driven forecast is a 36% EPS shrinkage into 2020, and a 34% EPS growth into 2021.
Based on current stock market valuations, we can use earnings growth valuation metrics to back into the required growth rate to justify Fidelity’s $142 stock price. These are often referred to as market embedded expectations.
In order to justify current stock prices, the company would need to have Uniform earnings grow by 20% per year over the next three years. What Wall Street analysts expect for Fidelity’s earnings growth is below what the current stock market valuation requires in 2020, but above what the market requires in 2021.
Furthermore, the company’s earning power is 8x the corporate average. Also, cash flows are 2x their total obligations—including debt maturities, capex maintenance, and dividends. Together, this signals low credit risk and dividend risk.
To conclude, Fidelity’s Uniform earnings growth is below peer averages in 2020. However, the company is trading above average peer valuations.
Best regards,
Joel Litman & Rob Spivey
Chief Investment Strategist &
Director of Research
at Valens Research