
Uniform Accounting shows how the “shrink to grow” strategy has unlocked massive value for this business, and could continue to

This company highlights the power of the “shrink to grow” strategy.
As-reported metrics show a company with stagnant profitability even after a massive initiative to rationalize its business units.
Uniform Accounting shows in reality, this company is a classic example of the powers of the “shrink to grow” strategy and how it can create value for shareholders and boost returns.
Also below, Uniform Accounting Embedded Expectations Analysis and the Uniform Accounting Performance and Valuation Tearsheet for the company.
Investor Essentials Daily:
Tuesday Tearsheets
Powered by Valens Research
The “shrink to grow” strategy has become a common mantra in the business world. Trimming down operations, branches, subsidiaries, and staff in order to become more profitable is a move that has its risks, but can enable a company to refocus and then accelerate growth thereafter.
The phenomenon goes back some time, but is most clearly traced back to a thought piece published by Bain & Company in 2005 called “Shrinking to grow”.
For mature companies, selling low-return assets to free up capital and pursue more profitable ventures is only logical.
As we highlighted though, the idea has been around much longer.
“Neutron” Jack Welch followed this mantra at General Electric (GE). He sold 71 business units within his first two years as CEO to get out of poorer performing businesses.
IBM (IBM) pursued much the same strategy under Louis Gerstner during the 1990s and early 2000s.
These businesses were able to grow by shrinking. Exiting stagnant businesses that weren’t generating returns like they used to led to long-term earnings and earning power (Uniform ROA) growth.
In the Bain piece, the authors highlighted two consumer products companies as case studies. Both Nestlé (NSRGY) and Heinz (n.k.a. Kraft Heinz, KHC) set-up their businesses for longer-term growth by streamlining certain businesses and reducing costs.
Nestlé transformed its Buitoni brand from a stagnant dry pasta business into an innovative ready-made ravioli and sauce brand.
Heinz sold its widely recognized StarKist tuna brand, using the proceeds to innovate in its core brands—creating things like the upside-down easy squeeze ketchup bottle.
Texas Instruments (TXN) initially appears to be a great candidate for the strategy. A semiconductor company with thousands of product patents, the company has heavily invested in various industries.
Alongside their semiconductors, they have also developed technologies in the defense industry, produced consumer electronics (credited with the development of the first transistor radio), and calculators.
At one point, they even invested in artificial intelligence and software.
With the diverse number of industries Texas Instruments has made contributions to, one would think that not all of them would remain profitable and sustainable in the long term.
The company appears to have come to this realization too, as management has constantly trimmed down the fat and sold off some of their business to other companies in the past several years. This includes selling their defense business to Raytheon, and selling their software business to Sterling Software.
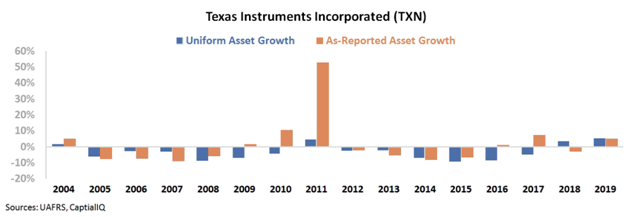
This is clear when looking at the company’s Uniform Accounting asset growth the past 15 years, which has consistently been negative as the company enacted its “shrink to grow” strategy.
Today, Texas Instruments has only two divisions, Semiconductors and Educational Technology.
While they may have trimmed down significantly, the firesale appears to have done little to improve the business.
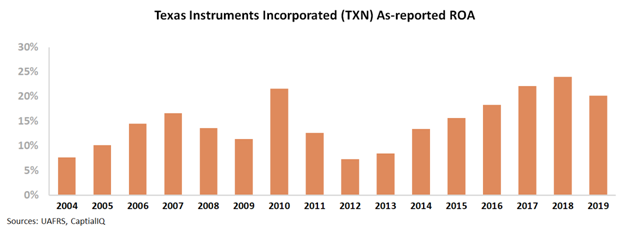
Based on as-reported metrics, selling some of their valuable assets, and leaving little room for investment has only modestly boosted their profitability, generating return on assets (ROA) that have consistently been between 10%-20%, without any sustainable boost.
If anything, the divestitures appear to have supported the cyclicality of the business, but not actually boosted profitability significantly. Peak as-reported ROA was 21% in 2010, it peaked at 24% in 2018.
But once we remove accounting distortions, including around goodwill, R&D investment, and operating cash among other issues, Uniform Accounting shows a very different picture.
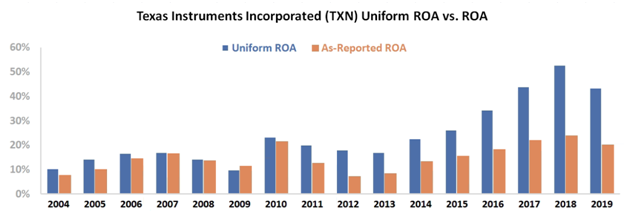
Trimming down their businesses was the right move to do, as their Uniform ROA has improved massively. It peaked below 20% in 2007, at 23% in 2010, and rose to 53% in 2018.
As-reported metrics, and the investors who use them, missed the picture that Texas Instruments’ “shrink to grow” strategy has actually worked. The company’s strategy to exit non-core businesses and invest in higher value add opportunities has created massive value.
While near-term macro-uncertainty is likely to create volatility for the company and most other businesses, this strategy is likely to continue to offer fundamental tailwinds for the business.
Texas Instruments Incorporated Embedded Expectations Analysis – Market expectations are for Uniform ROA to recover towards peak levels, but management may be concerned about demand, macro uncertainty, and fab closures
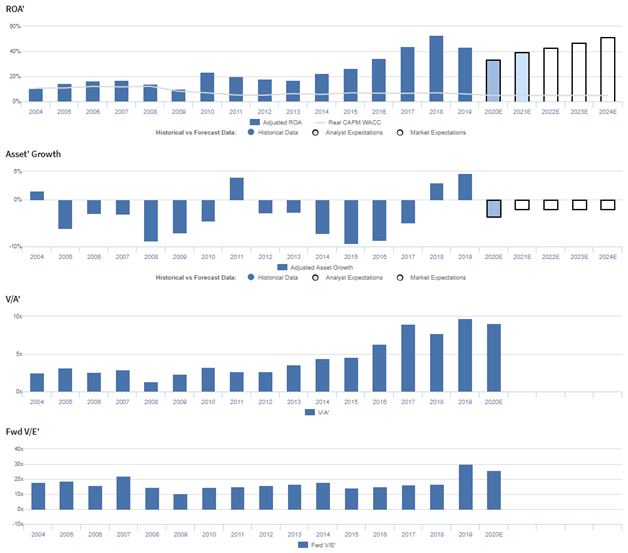
TXN currently trades near corporate averages relative to Uniform earnings, with a 26.0x Uniform P/E (Fwd V/E’). At these levels, the market is pricing in expectations for Uniform ROA to expand from 44% in 2019 to 52% in 2024, accompanied by 2% Uniform asset shrinkage going forward.
Analysts have similar expectations, projecting Uniform ROA to decline to 40% by 2021, accompanied by 4% Uniform asset shrinkage.
Historically, TXN has seen somewhat cyclical, though generally improving profitability. From 2004-2007, the firm saw Uniform ROA improve from 10% to 17%, before declining to 10% levels in 2009.
Thereafter, in 2010, Uniform ROA jumped to 23%, in part due to the firm’s strategic pivot towards its current business lines, and despite fading to 17% in 2013, Uniform ROA then expanded to a peak of 53% in 2018.
However, these improvements have largely been driven by TXN’s consistent shrinkage of their Uniform asset base, rather than by fundamental improvements. Specifically, in twelve of the past sixteen years, the firm has shrunk their Uniform asset base by 3%-9%. Recently, as Uniform asset growth has inflected positively, Uniform ROA has subsequently declined to 44% in 2019.
Performance Drivers – Sales, Margins, and Turns
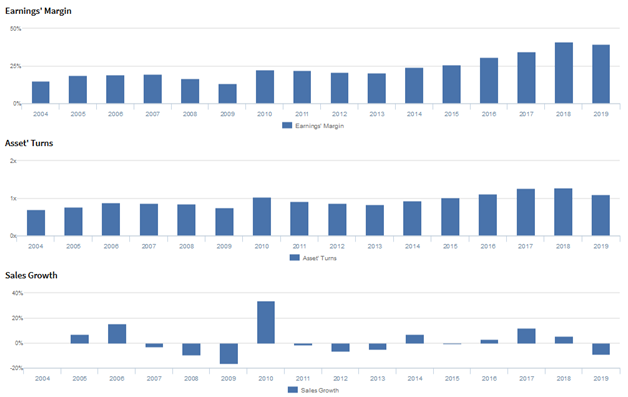
Improvements in Uniform ROA have been driven by improvements in both Uniform earnings margin and Uniform asset turns.
From 2004-2007, Uniform margins expanded from 15% to 20%, before declining to 13% in 2009. Subsequently, Uniform margins jumped to 23% in 2010, and despite fading to 21% in 2013, they then rebounded to 39%-41% levels in 2018-2019.
Meanwhile, Uniform turns rose from 0.7x in 2004 to 0.9x in 2007, before fading back to 0.7x in 2009. Then, Uniform turns subsequently recovered to 1.0x in 2010, and fell back to 0.8x levels in 2013, before expanding to 1.3x levels in 2017-2018. Recently, Uniform turns have faded to 1.1x in 2019.
At current valuations, markets are pricing in expectations for both Uniform margins and Uniform turns to recover from recent declines.
Earnings Call Forensics
Valens’ qualitative analysis of the firm’s Q4 2019 earnings call highlights that management may be concerned about declines across their end markets, demand seasonality, and macro uncertainty.
In addition, they may be exaggerating the strength of their balance sheet and their ability to strengthen their competitive advantages, and they may be downplaying concerns about fab closures and their older product revenue mix.
UAFRS VS As-Reported
Uniform Accounting metrics also highlight a significantly different fundamental picture for TXN than as-reported metrics reflect.
As-reported metrics can lead investors to view a company to be dramatically stronger or weaker than real operating fundamentals highlight.
Understanding where these distortions occur can help explain why market expectations for the company may be divergent.
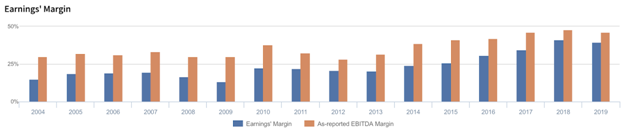
As-reported metrics significantly overstate TXN’s margins, one of the primary drivers of profitability.
For example, as-reported EBITDA margin for TXN was 46% in 2019, materially higher than Uniform earnings margin of 40%, making TXN appear to be a much stronger business than real economic metrics highlight.
Moreover, as-reported margins have been materially larger than Uniform margins in each year since 2004, distorting the market’s perception of the firm’s profitability for nearly two decades.
SUMMARY and Texas Instruments Incorporated Tearsheet
As the Uniform Accounting tearsheet for Texas Instruments Incorporated (TXN) highlights, it trades at a 26.0x Uniform P/E, which is around the corporate average valuations and its historical average valuations.
Average P/Es require average EPS growth to sustain them. In the case of Texas Instruments, the company has recently shown an 11% Uniform EPS shrinkage.
Wall Street analysts provide stock and valuation recommendations that in general provide very poor guidance or insight. However, Wall Street analysts’ near-term earnings forecasts tend to have relevant information.
We take Wall Street forecasts for GAAP earnings and convert them to Uniform earnings forecasts. When we do this, Texas Instruments’ Wall Street analyst-driven forecast is for Uniform EPS shrinkage of 25% in 2020, followed by 22% growth in 2021.
Based on current stock market valuations, we can back into the required earnings growth rate that would justify $119 per share. These are often referred to as market embedded expectations.
In order to meet current market valuation levels, Texas Instruments would have to grow Uniform earnings by 1% each year over the next three years.
What Wall Street analysts expect for Texas Instruments’ earnings growth is higher than what the current stock market valuation requires.
Meanwhile, the company’s earnings power is 7x corporate averages, and their robust cash flows and cash on hand signal that there is low risk to the company’s operations and credit profile.
To conclude, Texas Instruments’ Uniform earnings growth is below peer averages, but the company’s price to earnings is above peer average valuations.
Best regards,
Joel Litman & Rob Spivey
Chief Investment Strategist &
Director of Research
at Valens Research