
UAFRS showed a transformation in this business that GAAP missed, knowing that made us think a peer that can repeat this is a screaming buy

Faced with shrinking growth opportunities, this company has been able to add another line of business by rethinking how to monetize its assets differently. Its business model is so impressive that when one of its competitors decided to follow suit, we moved it to the top of our Conviction Long Idea List.
As-reported metrics claim this initiative has not done much in generating value. Uniform Accounting thinks differently.
Also below, Uniform Accounting Embedded Expectations Analysis and the Uniform Accounting Performance and Valuation Tearsheet for the company.
Investor Essentials Daily:
Tuesday Tearsheets
Powered by Valens Research
Jack Welch was a true believer of Peter Drucker, who advised him to ask himself and business leaders in each of his businesses, “If you weren’t already in this business today, would you enter it?”
From that came Welch’s “be first or second or get out” of each industry mantra. Yet how can you decide which businesses you are best in class in if you can’t actually benchmark yourself?
That’s a key issue with as-reported metrics, and a key focus of Uniform Accounting, and it helped us find one of our favorite ideas on our Conviction Long Idea List.
We bring this idea to clients all the time and talk about just how compelling it is to us. The reason why is due to something similar Uniform Accounting sees about one of its competitors, UnitedHealth (UNH).
When UnitedHealth was still mainly in the insurance and health maintenance organization businesses, the company realized it would soon struggle to generate earnings growth in the space. It had become so big that regulators in almost every U.S. state won’t let the firm grow in the health insurance business anymore.
Instead of accepting its own demise, what UnitedHealth did instead was rethink how they could monetize their assets better.
As the largest health insurer in the U.S., they have better health care data and knowledge about patient outcomes than everyone else. This allowed them to launch Optum, their health services business, in 2011.
By combining data from their claims data, pharmacy benefit management (PBM), and other information sources, they were able to enter into a different addressable market by offering healthcare analytics solutions to governments, life science companies, and hospitals, and also optimize the operations of their own pharmacy benefits manager and insurance business.
Optum should have created significant value for UnitedHealth, but looking at as-reported metrics, it seems like it has barely contributed to the firm’s profitability. As-reported ROA has been flat for the better part of a decade.
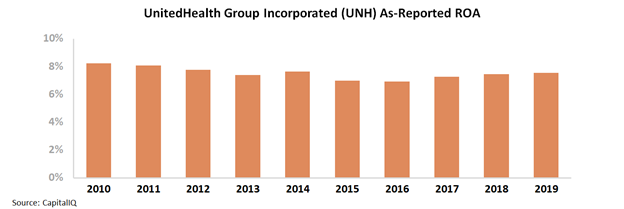
When we talk about the transformation the company has undergone with Optum, our clients ask why that doesn’t show up in UnitedHealth’s fundamentals. After all, if they’ve transformed, why is as-reported ROA down from post-recession levels?
The answer is that the company’s financial data is bad.
When you look at Uniform ROA and remove the accounting noise, you can see just how strong this business is and how quickly they’ve improved returns. Since the establishment of the Optum subsidiaries in 2011, UnitedHealth’s Uniform ROA has expanded from 26% to 36% currently.

Optum’s success has transformed UnitedHealth’s business, now making up half of the firm’s total revenues. The market has noticed this change too, which is why shares have been up tremendously.
This is why we love its competitor as one of our conviction long ideas. We fully expect this competitor to transform itself much like UnitedHealth did with Optum, and have very similar returns to what UnitedHealth has had over the last ten years, which is roughly a 10-bagger. But if we were looking at the as-reported metrics, we would have never known the transformation happened.
UnitedHealth Group Incorporated Embedded Expectations Analysis – Market expectations are for declining Uniform ROA, but management is excited about their data analysis and confident about Harmony and OptumHealth
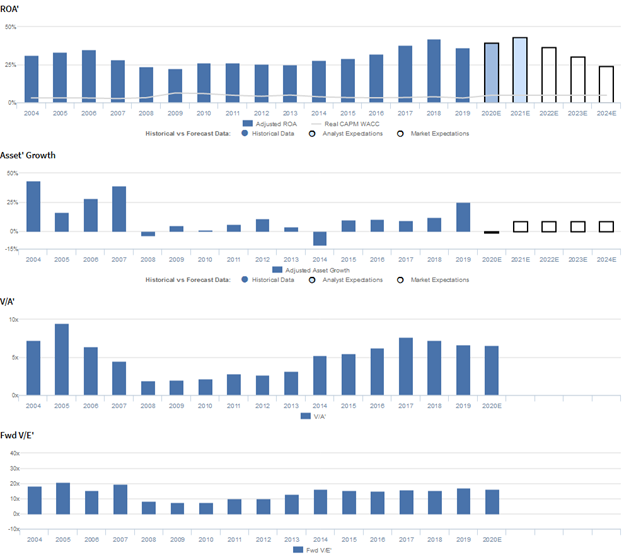
UNH currently trades near recent averages relative to Uniform earnings, with an 16.1x Uniform P/E (Fwd V/E′). At these levels, the market is pricing in expectations for Uniform ROA to contract from 36% in 2019 to 24% in 2024, accompanied by 9% Uniform asset growth going forward.
Meanwhile, analysts have bullish expectations, projecting Uniform ROA to improve to 44% by 2021, accompanied by 1% Uniform asset shrinkage.
Historically, UNH has seen robust and somewhat cyclical profitability.
After regressing from 40% in 2004 to 22% in 2009, amidst recessionary headwinds, Uniform ROA improved to 26%-29% levels through 2015, before expanding further to a peak of 42% in 2018 and declining back again to 36% in 2019.
Meanwhile, Uniform asset growth has steadily declined, positive in fifteen of the past sixteen years, while dropping from 17%-58% levels in 2003-2007 to just -10% to 12% levels before increasing to 25% in 2019.
Performance Drivers – Sales, Margins, and Turns
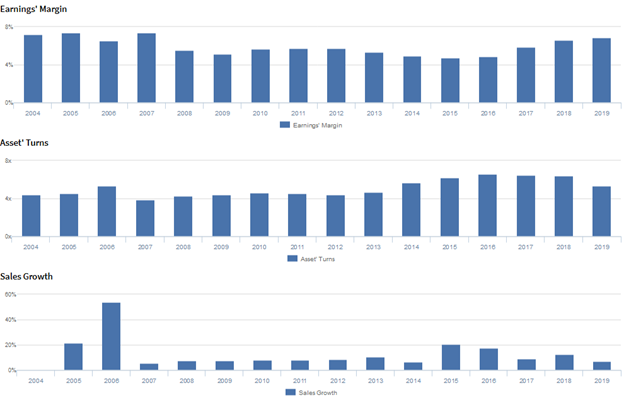
Robust profitability has been driven by improvements in Uniform asset turns, which have more than offset declines in Uniform earnings margins.
After sustaining 7% levels from 2003-2007, Uniform margins fell to 5%-6% levels through 2017, before recovering to 7% in 2019.
Meanwhile, Uniform asset turns expanded from 5.0x in 2003 to 5.5x in 2004, before declining to just 4.4x by 2008-2009. Afterwards, Uniform turns steadily improved to peak 6.8x levels in 2016, before fading to 5.3x in 2019.
At current valuations, markets are pricing in expectations for Uniform margins to stabilize, coupled with declines in Uniform turns going forward.
Earnings Call Forensics
Valens’ qualitative analysis of the firm’s Q4 2019 earnings call highlights that management generated an excitement marker when saying that the health system they are building leverages next-gen data analysis.
In addition, they are confident that Harmony provides a consumer experience that grants as much as 20% savings for fully insured customers and that OptumHealth allows physicians to make the best possible judgement to manage the risk profile of a patient.
However, management may be concerned about earnings seasonality, their capital deployment strategy, and North Carolina Medicaid issues.
Also, they may be exaggerating their opportunities to reduce medical and operating costs, their focus on innovation, and the quality of their Optum customer relationships.
Moreover, they may lack confidence in their ability to meet revenue and margin targets, and they may be concerned about their acquisition of Diplomat and the outlook for Medicare Advantage.
UAFRS VS As-Reported
Uniform Accounting metrics also highlight a significantly different fundamental picture for UNH than as-reported metrics reflect.
As-reported metrics can lead investors to view a company to be dramatically stronger or weaker than real operating fundamentals highlight.
Understanding where these distortions occur can help explain why market expectations for the company may be divergent.
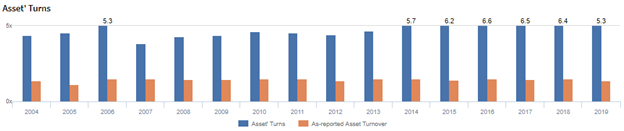
As-reported metrics significantly understate UNH’s asset utilization, a key driver of profitability.
For example, as-reported asset turnover for UNH was 1.4x in 2019, substantially lower than Uniform turns of 5.3x, making UNH appear to be a much weaker business than real economic metrics highlight.
Moreover, as-reported asset turnover has been at 1.4x-1.5x levels since 2008, while Uniform turns have risen from 4.4x-6.4x during the same period, directionally distorting the market’s perception of the firm’s asset efficiency trends for over a decade.
SUMMARY and UnitedHealth Group Incorporated Tearsheet
As the Uniform Accounting tearsheet for UnitedHealth Group Incorporated (UNH) highlights, the Uniform P/E trades at 16.1x, which is below corporate average valuation levels, but around its own recent history.
Low P/Es require low EPS growth to sustain them. In the case of UnitedHealth Group, the company has recently shown a 12% Uniform EPS growth.
Wall Street analysts provide stock and valuation recommendations that in general provide very poor guidance or insight. However, Wall Street analysts’ near-term earnings forecasts tend to have relevant information.
We take Wall Street forecasts for GAAP earnings and convert them to Uniform earnings forecasts. When we do this, UnitedHealth Group’s Wall Street analyst-driven forecast is a 10% and 11% growth in 2020 and 2021, respectively.
Based on current stock market valuations, we can use earnings growth valuation metrics to back into the required growth rate to justify UnitedHealth Group’s $285 stock price. These are often referred to as market embedded expectations.
In order to justify current stock prices, the company would need to have Uniform earnings grow by 1% each year over the next three years. What Wall Street analysts expect for UnitedHealth Group’s earnings growth is above what the current stock market valuation requires.
Furthermore, the company’s earning power is 6x the corporate average. Also, cash flows are 4x higher than its total obligations including debt maturities, capex maintenance, and dividends. Together, this signals low credit and dividend risk.
To conclude, UnitedHealth Group’s Uniform earnings growth is above peer averages. However, the company is trading below average peer valuations.
Best regards,
Joel Litman & Rob Spivey
Chief Investment Strategist &
Director of Research
at Valens Research


