
Uniform Accounting highlights how this company has built a successful niche in a cutthroat industry

While the payment processing industry is notoriously profitable, not all segments of the market are able to share in that wealth.
Most of the business tends to flow to the largest and most innovative payment firms, but that doesn’t mean there’s nothing left for the rest of the industry.
Today’s company has built its own niche in the payment processing industry, but its success is only clear with Uniform Accounting.
Also below, Uniform Accounting Embedded Expectations Analysis and the Uniform Accounting Performance and Valuation Tearsheet for the company.
Investor Essentials Daily:
Tuesday Tearsheets
Powered by Valens Research
When we talk about payment processing, you may be inclined to think of one of two major groups.
The first is the “800-pound gorillas”—major players in the industry like Visa (V), Mastercard (MA), American Express (AXP), and Discover (DFS) in America, or UnionPay if you’re in China.
In many cases, these are the founding fathers of the industry—they are the foundation of the whole modern payment system.
The second group you may be thinking of is the “disruptors”—fairly young companies looking to change the way the industry operates.
These are companies like PayPal (PYPL) who have made major strides in areas like cashless and contactless payments.
These two groups appear to be fighting over the value in the industry, and they each appear to be doing this successfully.
It’s no secret that Visa and Mastercard practically print their own money, but PayPal is a fantastically profitable business too.
These companies cover the vast majority of the value chain in the industry. Pretty much the only activity they don’t touch heavily is the “last mile” of the payments industry—ATMs and point-of-sale (“POS”) services.
Because the major players all stay away from the last mile of the chain, it’s easy to assume there’s little excess value to be generated, especially considering how much of a commodity ATMs and POS systems tend to be.
A great example is Euronet Worldwide (EEFT). Euronet is a major global ATM and POS operator.
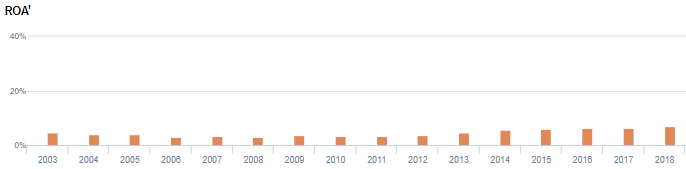
In its history, it’s tended to generate near cost-of-capital returns, with return on assets (ROA) never improving above 7%.
However, the last mile of the payments industry is more profitable than you might think, and Euronet’s as-reported ROA is not reflective of reality.
Euronet has done a good job of carving its niche as a major player in the ATM services space. Over the last several years, the company has invested heavily in consolidation which has significantly boosted its profitability.
Much like Visa, this has led Euronet to mint money. As-reported metrics fail to show this trend because they unfairly punish companies like Euronet for balance sheet items like goodwill and excess cash.
Once we remove these, we can see that the company’s acquisition strategy has driven profits, similar to that of other top-tier payment processing companies.

Uniform ROA was 29% in 2018, far higher than as-reported metrics would indicate.
The market already appears to recognize this discrepancy. Euronet currently trades slightly above market averages with a 23.5x Uniform P/E, and the market is pricing in stable profitability going forward.
That said, in the company’s most recent earnings call, management generated several markers that indicate they may be concerned about their portfolio of digital payment and ePay solutions, and they may have concerns about their ability to effectively partner with larger companies like Apple (AAPL).
While the market already appears to understand Euronet’s real, stronger, Uniform profitability, investors may be blindsided by operational issues as the company seeks to continue growing.
Euronet Worldwide, Inc. Embedded Expectations Analysis – Market expectations are for Uniform ROA to improve, but management may be concerned about their digital portfolio, operating income, and international expansion
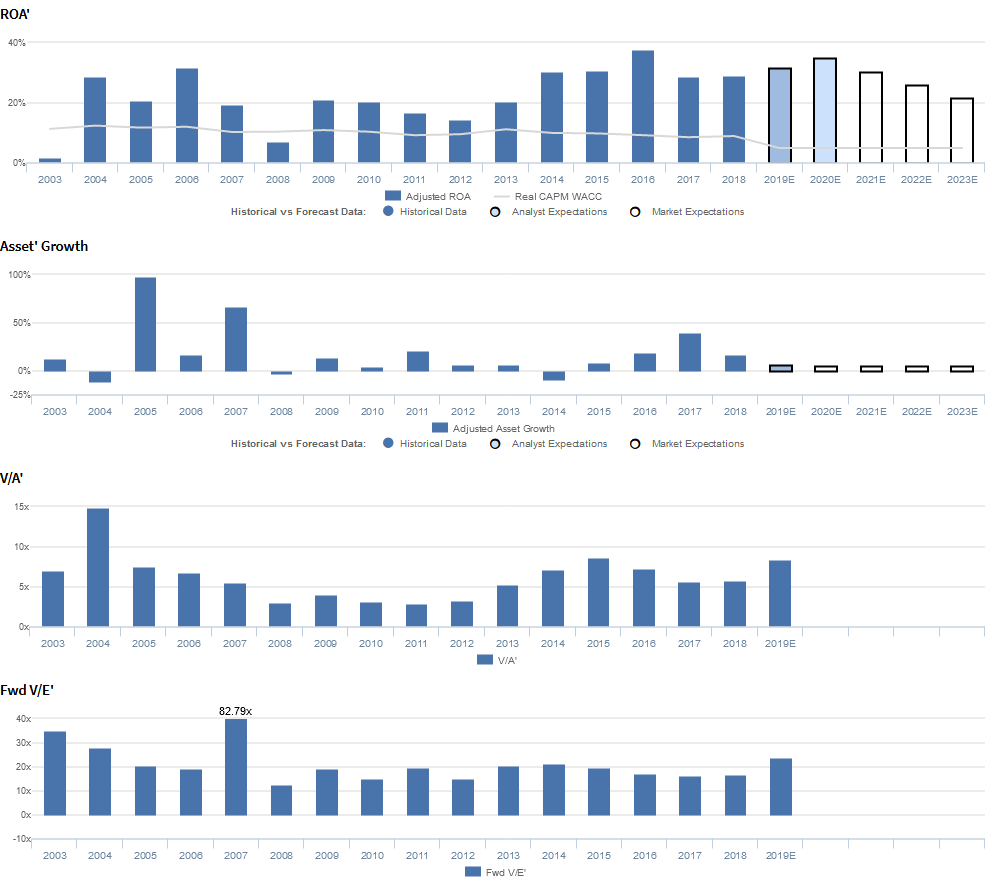
EEFT currently trades above historical averages relative to Uniform earnings, with a 23.5x Uniform P/E (Fwd V/E’).
At these levels, the market is pricing in expectations for Uniform ROA to improve slightly from 29% in 2018 to 19% by 2023, accompanied by 5% Uniform asset growth going forward.
Meanwhile, analysts have more bullish expectations, projecting Uniform ROA to improve to 35% through 2020, accompanied by 6% Uniform asset growth.
EEFT has seen cyclical, but steadily expanding profitability. After improving from 2% in 2003 to 32% in 2006, Uniform ROA collapsed to 7% in 2008, before recovering to 21% in 2009.
Thereafter, Uniform ROA fell to 14% in 2012, before reaching peaks of 38% in 2016, and sliding to 29% levels through 2017-2018.
Meanwhile, Uniform asset growth has been volatile, positive in nine of the past sixteen years, while ranging from -11% to 40% since 2003, excluding 98% growth in 2005 and 66% growth in 2007, due to a string of acquisitions in both years.
Performance Drivers – Sales, Margins, and Turns
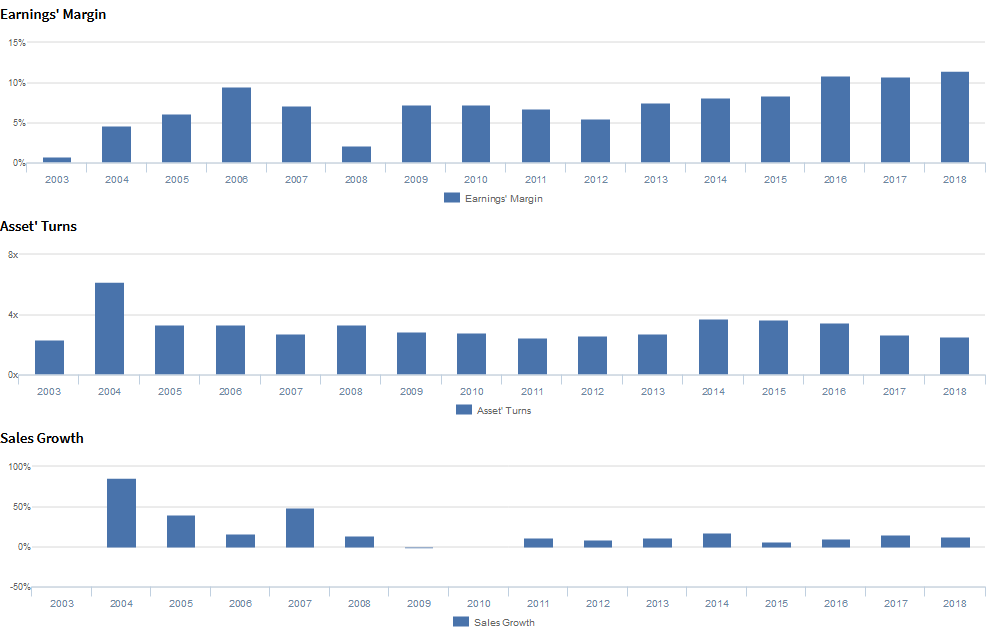
Expansion in Uniform ROA has been driven by trends in both Uniform asset turns and Uniform earnings margin. Uniform earnings margins expanded from 1% in 2003 to 10% in 2006, before fading to 2% in 2008. Thereafter, Uniform earnings margins recovered to 6%-7% levels in 2009-2012, before improving further to 12% in 2018.
Meanwhile, Uniform asset turns rose from 2.3x in 2003 to 6.2x in 2004, before falling to 2.5x in 2011. Then, Uniform asset turns improved to 3.7x levels in 2014-2015, and subsequently fell back to 2.5x in 2018.
At current valuations, markets are pricing in expectations for Uniform earnings margins to continue improving, and for Uniform asset turns to reverse recent trends.
Valens Qualitative analysis of the firm’s Q4 2019 earnings call highlights that management is confident that they had an exceptional year in 2019 and that they have plenty of growth potential left in Europe.
In addition, they are confident that they renewed their ATM network partnership agreement with BNP Paribas Group in Ukraine and signed an issuer processing agreement with PT Bank Artos in Indonesia.
However, management is also confident that they expected a 3% headwind on Money Transfer’s top-line growth from Walmart’s new ID requirement, and they may be concerned about the progress of the Walmart2World ramp-up.
Moreover, they may lack confidence in their ability to sustain double-digit growth in international remittances, continue to improve EPS, and expand their reach across more consumer bank accounts.
Furthermore, they may be downplaying concerns about their epay gross profit mix and the impact of winterizing ATMs in seasonal areas, and they may be concerned about their real-time payment agreement with the Federal Bank in India.
UAFRS VS As-Reported

Uniform Accounting metrics also highlight a significantly different fundamental picture for EEFT than as-reported metrics reflect.
As-reported metrics can lead investors to view a company to be dramatically stronger or weaker than real operating fundamentals highlight. Understanding where these distortions occur can help explain why market expectations for the company may be divergent.
As-reported metrics significantly understate EEFT’s profitability.
For example, as-reported ROA for EEFT was 7% in 2018, materially lower than Uniform ROA of 29% that year, making EEFT appear to be a much weaker business than real economic metrics highlight.
Moreover, since 2009, as-reported ROA has been less than a third of Uniform ROA, distorting the market’s perception of the firm’s profitability ceiling for over a decade.
SUMMARY and Euronet Worldwide, Inc. Tearsheet
As the Uniform Accounting tearsheet for Euronet Worldwide, Inc. (EEFT) highlights Uniform P/E trades at 23.5x, which is around the global corporate average valuation levels, but above its own historical level.
High P/Es require high EPS growth to sustain them. In the case of Euronet, the company has recently shown a 22% Uniform EPS growth.
Wall Street analysts provide stock and valuation recommendations that in general provide very poor guidance or insight. However, Wall Street analysts’ near-term earnings forecasts tend to have relevant information.
We take Wall Street forecasts for GAAP earnings and convert them to Uniform earnings forecasts. When we do this, Euronet’s Wall Street analyst-driven forecast is 17% for 2019. That improves to a 20% growth in earnings in 2020.
Based on current stock market valuations, we can back into the required earnings growth rate that would justify $92 per share. These are often referred to as market embedded expectations. In order to meet the current market valuation levels for Euronet, the company would have to have Uniform earnings grow by 10% each year over the next three years.
What Wall Street analysts expect for Euronet’s earnings growth increases far above what the current stock market valuation requires.
Meanwhile, the company’s earnings power is 5x corporate averages, signaling that there is very low cash flow risk to the company’s operations and credit profile.
To conclude, Euronet’s Uniform earnings growth is above peer averages. Also, the company is trading above average peer valuations as well.
Best regards,
Joel Litman & Rob Spivey
Chief Investment Strategist &
Director of Research
at Valens Research


