
Uniform accounting shows the market expects this company to continue to make massive profits from a conflict of interest that may not last

Throughout much of modern history, ratings agencies were considered some of the most powerful companies in the world.
All that changed when they couldn’t sustain their businesses simply by selling reports to investors. This led to one of the biggest conflicts of interest on Wall Street.
Today’s company found itself at the center of this issue during the Great Recession, but it has taken several steps to improve the business since. But those improvements aren’t apparent using distorted as-reported accounting.
Also below, Uniform Accounting Embedded Expectations Analysis and the Uniform Accounting Performance and Valuation Tearsheet for the company.
Investor Essentials Daily:
Thursday Tearsheets
Powered by Valens Research
There was a time when the ratings agencies were some of the most powerful corporations in the world.
Journalist Thomas Friedman had a great quote during a PBS NewsHour in 1996 where he said:
“There are two superpowers in the world today… There’s the United States and there’s Moody’s Bond Rating Service. The United States can destroy you by dropping bombs, and Moody’s can destroy you by downgrading your bonds.”
Things have changed slightly since then, however. The 2008 financial crisis brought to light a lot of the issues around the way ratings agencies like Moody’s (MCO) do business.
There’s a glaring conflict of interest between the ratings agencies and the corporations they rate.
Given that there are three major ratings agencies that all offer nearly identical services, the agencies compete with one another for corporate clients by offering the best “quality.”
Since the agencies want to retain their clients, this competition has turned the system into a game of “which rating agency will give my corporation the highest rating?”
This issue was exposed during the Great Recession when a number of supposed investment-grade securities were eventually downgraded to high-yield “junk” territory after the market had already collapsed.
Unfortunately, none of this was part of John Moody’s business plan when he wrote the first ‘Moody’s Manual’ in 1900.
For its first 70 years of operation, Moody’s actively avoided conflict of interest because it refused to accept a dime from corporations.
Instead, the company made its money by selling reports to bankers and investors. This was considered the “investor pays” model—corporations weren’t considered clients—which helped remove bias from Moody’s analysis.
For many years this model worked well. After the creation of the SEC in the 1930s, ratings agencies became even more crucial. New regulations forbade banks from owning speculative ‘junk’ securities, and these were classified by the ratings agencies.
Unfortunately, starting in the 1970s, more than a decade after John Moody’s death, the company was forced to make a difficult choice.
Its revenues from the investor side were dwindling because it was becoming easier to replicate and redistribute Moody’s reports using photocopies and fax machines.
In order to save the business, Moody’s and the other agencies had to begin charging “issuers” for the privilege of being rated—they switched to an “issuer pays” model.
We know that led to a conflict of interest, but the impact on profitability seems less certain.
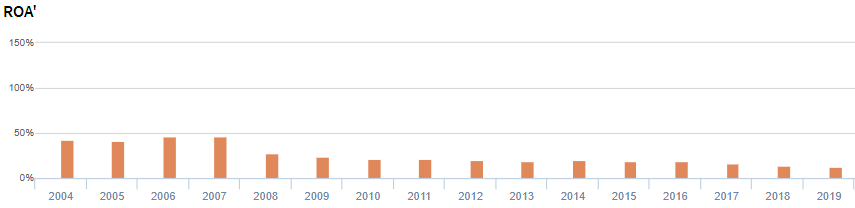
Although the company’s profitability was fairly strong leading up to the Great Recession, it appears ROA has continuously faded since, to a low of just 13% in 2019.
Since the recession, Moody’s has focused on expanding its data and analytics business beyond its legacy ratings function. Its goal is to diversify its business and minimize conflict of interest.
Despite this, profitability has continued falling, indicating the company’s strategy may not be working.
However, when we instead look at the company’s Uniform Accounting metrics, we can see that Moody’s has had success in recent years with its new analytics business.
Not only has ROA been consistently stronger than as-reported metrics would suggest, but it has also been improving over the last several years.
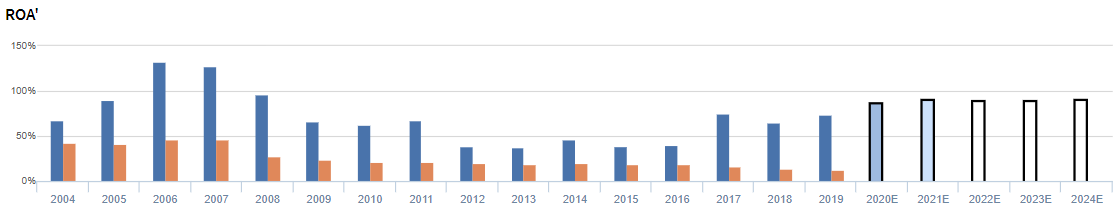
The markets already appear to recognize Moody’s real profitability trends, because current expectations are for Uniform ROA to continue expanding back to levels seen prior to 2008.
However, achieving these expectations may be easier said than done.
In the company’s most recent earnings call, management generated potentially concerning markers around their ability to continue recent revenue growth rates in their Moody’s Analytics business, and they may be concerned about interest rate risk. Furthermore, concerns around slowing issuer refinancings may prove to be a headwind to operations.
Should Moody’s fail to meet the market’s bullish expectations, the company’s stock could struggle.
Moody’s Corporation Embedded Expectations Analysis – Market expectations are for Uniform ROA expansion, but management may be concerned about growth, credit markets, and their acquisitions
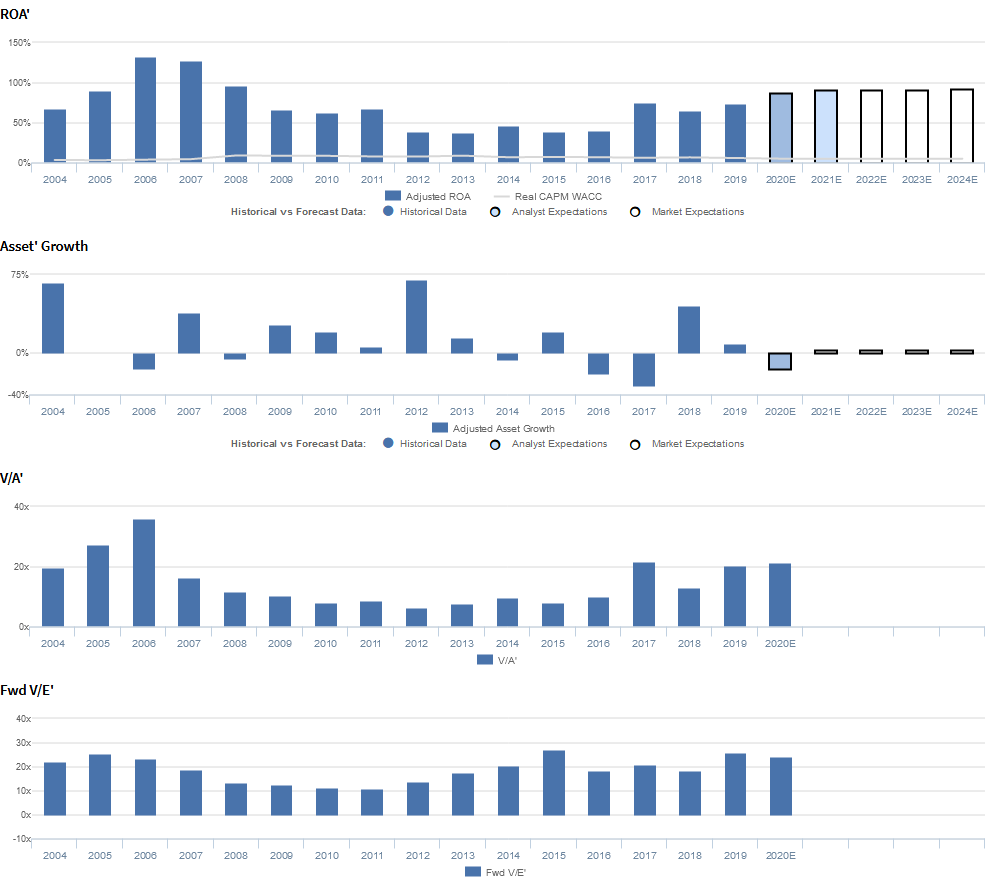
MCO trades at recent highs relative to Uniform earnings, with a 24.4x Uniform P/E (Fwd V/E′).
At these levels, the market is pricing in expectations for Uniform ROA to expand from 74% in 2019 to 93% in 2024, accompanied by 3% Uniform asset growth going forward.
Analysts have similar expectations, projecting Uniform ROA to improve to 91% through 2021, accompanied by 15% Uniform asset shrinkage.
Historically, MCO has achieved robust profitability far above the cost of capital, with Uniform ROA rising beyond 100% in some years. After improving from 68% in 2004 to a high of 133% in 2006, Uniform ROA dropped sharply to 66% in 2009, due to recessionary headwinds.
Thereafter, Uniform ROA faded to 38%-47% levels from 2012-2016, before rebounding to 74% in 2019.
Meanwhile, Uniform asset growth has been volatile, ranging from -31% to 70% since 2004, as the company continues to roll up competitors into their already asset-light operations.
Performance Drivers – Sales, Margins, and Turns

Historical trends in Uniform ROA have been driven by trends in both Uniform earnings margins and Uniform asset turns.
After improving from 32% in 2004 to 38% in 2007, Uniform earnings margins declined to 29% in 2009, before expanding to 34% in 2014, and collapsing to 25% in 2016. Thereafter, Uniform earnings margins rebounded to a high of 38% in 2019.
Meanwhile, after improving from 2.1x in 2004 to 3.7x in 2006, Uniform asset turns collapsed to a low of 1.1x in 2013. Then, Uniform asset turns rebounded to 2.6x in 2017, before compressing to 1.9x in 2019.
At current valuations, the market is pricing in expectations for Uniform earnings margins to remain near peak levels, coupled with continued improvement in Uniform asset turns.
Earnings Call Forensics
Valens qualitative analysis of the firm’s Q4 2019 earnings call highlights that management generated an excitement marker when saying that they can always think about changing their ownership position in CCXI.
In addition, they are confident that Moody’s Analytics had 140bps of margin improvement despite a 40bps headwind from inorganic acquisitions and that investment-grade bond dynamics in Europe continue to encourage reversion issues, which make up one-fourth of the region’s total issuances.
However, management is also confident declines in Q4 structured revenues were almost entirely due to CLOs and that CMBS is a particularly competitive ratings market.
Moreover, management may lack confidence in their ability to sustain growth in their US High-yield bond, ERS segment, and China-related revenues, and they may also lack confidence in their ability to expand their free cash flow, and identify cost efficiencies.
Furthermore, they may be concerned about investment-related margin headwinds, flat leveraged loan expectations, and geopolitical uncertainty surrounding the US presidential election.
They may also be exaggerating the strength of Moody’s Analytics’ fixed income investor base and the potential of their RDC acquisition to help build an efficient one-stop solution for compliance needs.
Finally, they may be concerned about shifts in their ERS business, and they may be overstating their ability to normalize incentive compensation and return capital to shareholders through stock buybacks and dividends.
UAFRS VS As-Reported

Uniform Accounting metrics also highlight a significantly different fundamental picture for MCO than as-reported metrics reflect.
As-reported metrics can lead investors to view a company to be dramatically stronger or weaker than real operating fundamentals highlight.
Understanding where these distortions occur can help explain why market expectations for the company may be divergent.
As-reported metrics significantly understate MCO’s profitability.
For example, as-reported ROA for MCO was 13% in 2019, a fraction of the Uniform ROA of 74% in the same year, making MCO appear to be a much weaker business than real economic metrics highlight.
Moreover, Uniform ROA has been at least double as-reported ROA in each year since 2003, materially distorting the market’s perception of the firm’s profitability for nearly two decades.
SUMMARY and Moody’s Corporation Tearsheet
As the Uniform Accounting tearsheet for Moody’s Corporation (MCO) highlights, Uniform P/E trades at 24.4x, which is above corporate average valuations and historical average valuations for the company.
High P/Es require high EPS growth to sustain them. In the case of Moody’s, the company has recently shown a Uniform EPS growth of 14%.
Wall Street analysts provide stock and valuation recommendations that in general provide very poor guidance or insight. However, Wall Street analysts’ near-term earnings forecasts tend to have relevant information.
We take Wall Street forecasts for GAAP earnings and convert them to Uniform earnings forecasts. When we do this, Moody’s Wall Street analyst-driven forecast is for Uniform EPS growth of 9% in 2020, and robust 8% Uniform EPS growth in 2021.
Based on current stock market valuations, we can back into the required earnings growth rate that would justify $220 per share. These are often referred to as market embedded expectations. In order to meet current market valuation levels, Moody’s would have to have Uniform earnings grow by 9% each year over the next three years.
What Wall Street analysts expect for Moody’s earnings growth is in line with what the current stock market valuation requires.
Meanwhile, the company’s earnings power is 12x corporate averages, and their robust cash flows and cash on hand signal that there is low risk to the company’s operations and credit profile.
To conclude, Moody’s Uniform earnings growth and price to earnings is in line with peer averages valuations.
Best regards,
Joel Litman & Rob Spivey
Chief Investment Strategist &
Director of Research
at Valens Research


