
Uniform Accounting shows this company is taking advantage of the need for data in making investing decisions

The rise of quantitative, or quant funds, comes with an increased need for data. These funds use advanced algorithms to sift through huge amounts of data and attempt to pick stocks.
Today’s company is a supplier of this type of financial data, and is poised to benefit from industry tailwinds in the data segment. However, looking at as-reported numbers, it appears that it has been struggling the last few years as funds operating under these strategies have lagged.
UAFRS (Uniform) based analysis, on the other hand, shows the firm’s real performance, with the market and as-reported metrics missing the profitability of the firm.
Also below, Uniform Accounting Embedded Expectations Analysis and the Uniform Accounting Performance and Valuation Tearsheet for the company.
Investor Essentials Daily:
Tuesday Tearsheets
Powered by Valens Research
Since around 2010, traditional factor analysis has seen its historic value slowly erode. Fama and French’s three-factor and five-factor models used to generate impressive returns, just by tilting portfolios to specific factors. However, alpha has declined significantly since the early 2010s.
The Fama and French three-factor model was an expansion of prior work on the Capital Asset Pricing Model (CAPM). The model helps to describe stock returns and is the basis for much of the work many quant funds do.
Tilting towards companies that were smaller, more profitable, more conservative in their growth, and had lower valuations should all generate impressive returns.
A potential reason for its recent underperformance may be that there are so many quant funds trying to leverage these factors.
Simply put, there may be too many cooks in the kitchen. As more and more quant funds pile in, these methods get more and more crowded, and any opportunity for profit is squashed.
Not to mention the impact of a variable economic landscape where a single tweet can send a company tumbling… Quant funds using predefined factors might have difficulty responding to these unpredictable outside forces.
Many market analysts prescribe this slipping of quant fund performance to an overdependence on data alone. The funds pay huge amounts of money to financial data companies like FactSet (FDS), S&P Capital IQ, and Bloomberg.
FactSet in particular appears to be hurt from this trend away from data usage. The company was founded in 1978, at the advent of the computer age.
During its first few years, all data was delivered to clients on paper, often from a bike messenger. In the early 1980s, it found a way to allow downloading data straight from the computer, cutting out several labor-intensive steps from the process.
FactSet has taken advantage of decades of trends toward financial data usage. Virtually every investor worldwide, save Warren Buffet and his printed out 10-Ks, now uses computers to access financial information.
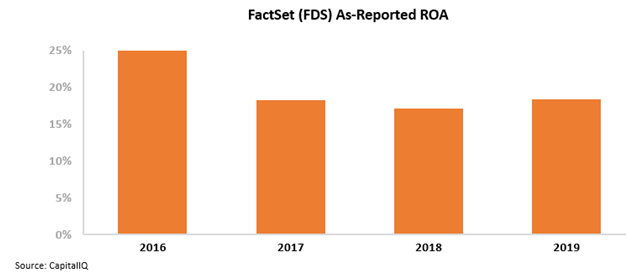
These tailwinds were reflected in well-above corporate average return on assets (ROA). In 2016, as-reported ROAs sat at 25%, the result of its industry leading position.
However, over the three years following, as-reported ROAs fell by more than a third, reflecting a possible shift away from data usage by these quant funds. With quant funds struggling to take advantage of factor investing, there is less of a need for these financial data aggregators like FactSet.
However, this picture of FactSet’s performance is inaccurate, pulled down by distortions in the same problematic as-reported accounting data that may be causing quant investors to have poor performance. Due to the GAAP treatment of goodwill and R&D expenses, among other distortions, as-reported metrics have missed the success of this firm.
FactSet has managed to create an integral data provider for investment professionals, capable of weathering down years in the market. Not to mention, the company has over a 95% client retention rate, indicating a high degree of business stability.
FactSet’s Uniform ROA has, in fact, expanded from 2016 levels, albeit slightly from 26% to 27%. This is in contrast to as-reported levels that have collapsed over the same time frame.
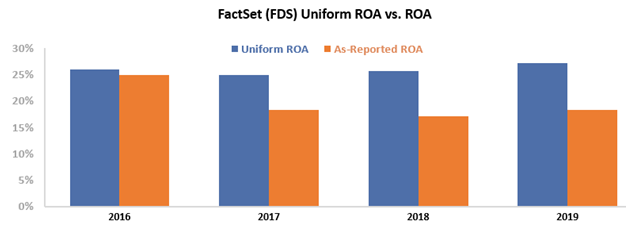
FactSet has made itself indispensable to its clients, and has been rewarded with above-average returns.
To understand if the market thinks this firm can continue to create this value for shareholders, we can use the Embedded Expectations Framework, which will give us insight into market valuations.
The chart below explains the company’s historical corporate performance levels, in terms of ROA (dark blue bars) versus what sell-side analysts think the company is going to do in the next two years (light blue bars) and what the market is pricing in at current valuations (white bars).
As you can see, market expectations are for a continued expansion of returns up to 42% Uniform ROA. This is despite the economic uncertainty caused by the current pandemic.

Ultimately, Uniform Accounting shows the true strength of FactSet’s business and the market’s bullish outlook for the company.
FactSet has a resilient business that is taking advantage of the growing interest in financial data providers, and it has done a great job of capturing these new users, with 55 new client wins in Q3 of this year alone.
Without Uniform Accounting, investors would miss a high-return business that is crucial to many quant funds’ success. Rather than an overreliance on data, perhaps it is the data itself that quant funds are using that has created a disconnect between the Fama-French model and profitability.
FactSet Research Systems Inc. Embedded Expectations Analysis – Market expectations are for continued Uniform ROA expansion, but management may have concerns about margins, ASV growth, and clients
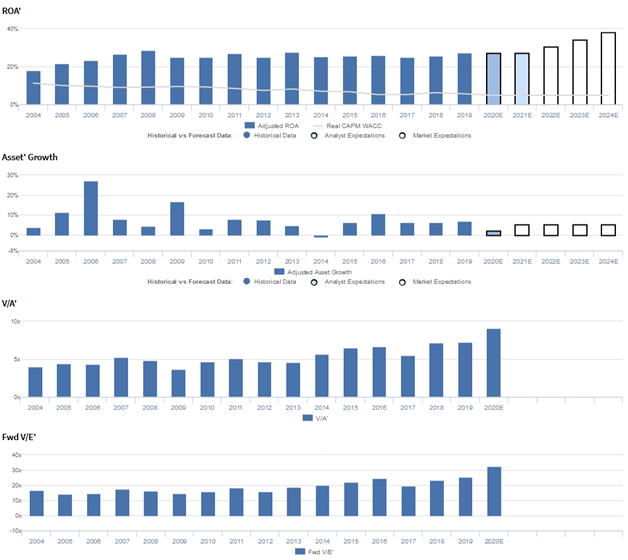
FDS currently trades above historical averages relative to Uniform earnings, with a 32.5x Uniform P/E (Fwd V/E’). At these levels, the market is pricing in expectations for Uniform ROA to expand from 27% in 2019 to 38% by 2024, accompanied by 5% Uniform asset growth going forward.
However, analysts have less bullish expectations, projecting Uniform ROA to remain at 27% through 2021, accompanied by 2% Uniform asset growth.
Historically, FDS has seen robust, generally improving profitability. After improving from 18% in 2004 to a peak of 29% in 2008, Uniform ROA has maintained 25%-28% levels since then, and currently sits at 27% in 2019.
Meanwhile, Uniform asset growth has been mostly consistent, positive in fifteen of the past sixteen years, while ranging from -1% to 27%.
Performance Drivers – Sales, Margins, and Turns
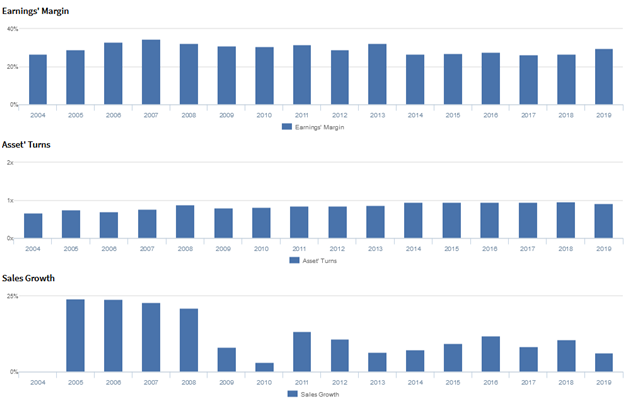
General improvements in Uniform ROA have been driven by trends in Uniform earnings margins, accompanied by improving Uniform asset turns.
After improving from 27% in 2004 to a peak of 35% in 2007, Uniform margins faded to 27% in 2014, before recovering to 30% in 2019.
Meanwhile, after improving from 0.7x in 2004 to 0.9x in 2008, Uniform turns faded to 0.8x through 2010, before stabilizing at 0.9x-1.0x levels from 2012-2019.
At current valuations, markets are pricing in expectations for Uniform margins to improve from current levels, coupled with further Uniform turns stability.
Earnings Call Forensics
Valens’ qualitative analysis of the firm’s Q2 2020 earnings call highlights that management generated an excitement marker when saying there will be no change to their investment plan hiring.
In addition, they are confident banking clients as a proportion of total clients is smaller now, compared to 10 years ago, and that their exposure to the pound and euro may benefit them.
However, management may lack confidence in their ability to sustain organic ASV and professional services growth, maintain client retention rates, and execute new business initiatives.
Moreover, they may have concerns about margin declines due to cost of sales and exchange rates, the potential of banks cancelling their subscriptions, and ongoing headwinds in their APAC operations.
Furthermore, they may be exaggerating the quality of their web-based product, and they may lack confidence in their ability to maintain coverage expansion, assist clients in accessing FactSet remotely, and execute their business continuity plans.
Finally, they may lack confidence in their ability to reduce third-party content costs and mitigate headwinds from a severe market downturn.
UAFRS VS As-Reported

Uniform Accounting metrics also highlight a significantly different fundamental picture for FDS than as-reported metrics reflect.
As-reported metrics can lead investors to view a company to be dramatically stronger or weaker than real operating fundamentals highlight. Understanding where these distortions occur can help explain why market expectations for the company may be divergent.
As-reported metrics significantly overstate FDS’ margins, a key driver of profitability. For instance, as-reported EBITDA margin in 2019 was 35%, substantially higher than Uniform earnings margin of 30%, making FDS appear to be a much stronger business than real economic metrics highlight.
Moreover, since 2014, as-reported EBITDA margin faded from 37% to 35%, while Uniform earnings margin expanded from 27% to 30% in the same time period, directionally distorting the market’s perception of the firm’s recent performance.
SUMMARY and FactSet Research Systems Inc. Tearsheet
As the Uniform Accounting tearsheet for FactSet Research Systems Inc. (FDS:USA) highlights, its Uniform P/E trades at 32.5x, which is above corporate average valuation levels and its historical average valuations.
High P/Es require high EPS growth to sustain them. In the case of FactSet, the company has recently shown a 21% Uniform EPS growth.
Wall Street analysts provide stock and valuation recommendations that in general provide very poor guidance or insight. However, Wall Street analysts’ near-term earnings forecasts tend to have relevant information.
We take Wall Street forecasts for GAAP earnings and convert them to Uniform earnings forecasts. When we do this, FactSet’s Wall Street analyst-driven forecast an EPS growth of 6% and 3% in 2020 and 2021, respectively.
Based on the current stock market valuations, we can use earnings growth valuation metrics to back into the required growth rate to justify FactSet’s $356 stock price. These are often referred to as market embedded expectations.
The company needs to have Uniform earnings grow by 11% each year over the next three years to justify current prices. What Wall Street analysts expect for FactSet earnings growth is below what the current stock market valuation requires.
Furthermore, the company’s earning power is 5x the corporate average. Also, cash flows are 3x higher than its total obligations—including debt maturities, capex maintenance, and dividends. Together, this signals low credit and dividend risk.
To conclude, FactSet’s Uniform earnings growth is above peer averages. Therefore, as is warranted, the company is also trading above average peer valuations.
Best regards,
Joel Litman & Rob Spivey
Chief Investment Strategist &
Director of Research
at Valens Research


