
Uniform Accounting shows whether this factor investor is seeing its factors distorted by accounting noise

Factor investing is an investment approach that uses quantifiable characteristics to build portfolios. There is little emphasis on individual stocks, but rather on repeatable processes in identifying “styles” to invest in.
Today’s fund is one of the world’s largest asset managers, employing a variety of different factors to invest. The legendary investor who created it spoke at an event we attended a few years ago about some of the strategies his fund employs.
In addition to examining the portfolio, we are including a deeper look into the fund’s largest current holding, providing you with the current Uniform Accounting Performance and Valuation Tearsheet for that company.
Investor Essentials Daily:
Friday Uniform Portfolio Analytics
Powered by Valens Research
A few members of Valens got to attend a presentation by famous investor Cliff Asness in Boston a few years ago. Cliff is the founder of AQR Capital Management, one of the world’s largest quantitative hedge funds.
AQR was formed in 1998 by Cliff and two colleagues from University of Chicago’s PhD program. By 2004, it already had $12 billion in assets under management (AUM).
At the time of the presentation, AQR was in the midst of some particularly material struggles with its quantitative strategies. The firm has an interesting philosophy that separates it from traditional long/short hedge funds.
Its goal is not to be great individual stock pickers, but to understand the factors that drive market performance. Then, it can identify big diversified portfolios that give the firm exposure to a specific set of factors. This is what is called “factor investing.”
Factor investing typically has many different styles, including value, momentum, growth, defensive, and carry to name just a few. AQR advocates using different factors together to have greater diversification while still generating superior returns.
This investing style is geared towards finding quantifiable firm characteristics which are able to explain differences in stock returns.
AQR is quoted as saying it wants to have “high conviction in the process, but not a high conviction in any particular stock.” It employs a more quantitative approach, rather than looking at qualitative factors of individual stocks.
During the presentation we attended, Asness talked about understanding whether a process is broken or just in an unlucky period, meaning it is not working as intended for a period of time as it should. At the time, AQR’s value-based strategies were lagging the market and expectations.
His point was you can have different factors simply go “out of vogue” for some time. However, this does not mean the system is permanently broken.
Take for example recently, value investing has been outperformed by other factors, including growth. Part of this has been because FAANG stocks have driven much of the S&P’s recent gains, while value has lagged behind.
One interesting question we have been building research around here at Valens is the impact of Uniform Accounting on factor portfolios. Specifically, whether investors would have better signals for factor portfolios through leveraging Uniform Accounting to help build and identify them.
In the past, we have seen Uniform Accounting financials-built backtests significantly outperform as-reported ones during the last decade.
Looking at one of AQR Capital Management’s largest funds, we can see how impressive it looks through the lens of Uniform Accounting.
AQR Large Cap Defensive Style Fund has over $6 billion in AUM. Its goal is to provide returns similar to its benchmark with lower volatility and less risk.
Using as-reported metrics, it would appear this AQR fund is buying sub-par companies with low returns. In reality, these names are dominant companies with high profitability and economic moats.
See for yourself below.
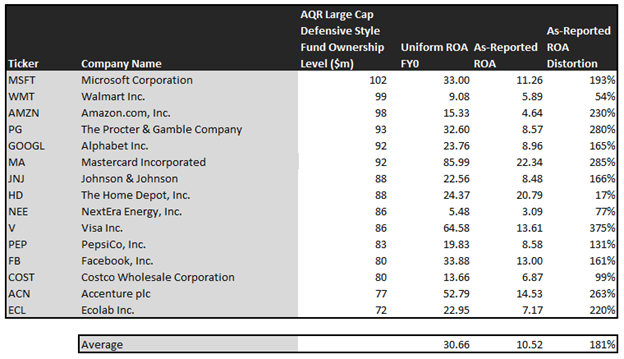
Using as-reported accounting, investors would think AQR is doing a poor job of identifying high-return companies.
On an as-reported basis, many of these companies are poor performers with returns below corporate averages, with the average as-reported return on assets (ROA) right around 11%.
In reality, the average company in the fund displays an impressive average Uniform ROA of 31%.
Once we make Uniform Accounting (UAFRS) adjustments to accurately calculate earning power, we can see the underlying strength of AQR’s picks amongst large cap stocks.
Once the distortions from as-reported accounting are removed, we can see Microsoft (MSFT) does not have an average return of 11%, but a sizable ROA of 33%.
Similarly, Mastercard’s (MA) ROA is really 86%, not 22%. While as-reported metrics are portraying the company as a slightly above average business, Uniform Accounting shows the company’s truly robust operations.
Alphabet (GOOGL) is another great example of as-reported metrics mis-representing the company’s profitability. Alphabet doesn’t have an 9% ROA, it is actually at 24%.
The list goes on from there, for names ranging from Visa (V) and Proctor and Gamble (PG), to Facebook (FB), PepsiCo (PEP), and Accenture (ACN).
Investors looking only at as-reported metrics would assume AQR is embracing low return business. Rather, the fund is making smart investments in strong performers to compound returns.
Now, let us see how these firm’s returns can strengthen over time through EPS growth.
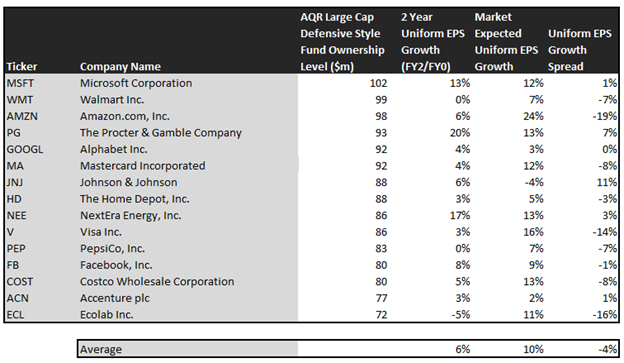
This chart shows three interesting data points:
- The 2-year Uniform EPS growth represents what Uniform earnings growth is forecast to be over the next two years. The EPS number used is the value of when we take consensus Wall Street estimates and we convert them to the Uniform Accounting framework.
- The market expected Uniform EPS growth is what the market thinks Uniform earnings growth is going to be for the next two years. Here, we show by how much the company needs to grow Uniform earnings in the next two years to justify the current stock price of the company. If you’ve been reading our daily analyses and reports for a while, you’ll be familiar with the term embedded expectations. This is the market’s embedded expectations for Uniform earnings growth.
- The Uniform EPS growth spread is the spread between how much the company’s Uniform earnings could grow if the Uniform earnings estimates are right, and what the market expects Uniform earnings growth to be.
The average company in the US is forecast to have 5% annual Uniform Accounting earnings growth over the next two years. As these firms are all large cap stocks that make up much of the market capitalization of its benchmarks, it is no surprise the average Uniform EPS Growth is close to 6%.
That being said, the market is pricing these companies for 10% EPS growth, slightly above the analyst predictions of 6%. It looks like the fund may not be choosing lower cost stable growth companies, but rather companies that need high growth. That being said, it may make sense in the context of the company buying “defensive” companies, as those companies trade at a premium now.
One example of a company with high growth potential is Proctor and Gamble (PG). While the market expects P&G to grow at 13% over the next two years, analysts forecast the firm to see a 20% growth over the same period.
Another example is Johnson and Johnson (JNJ). The company is cheap, as it is priced for a 4% contraction in Uniform earnings, but the company is forecast to in fact grow its EPS by 6% in the next two years.
That being said, there are some companies that are forecast to have earnings growth less than market expectations. For these companies, like Visa (V), PepsiCo (PEP), and Walmart (WMT), the market has growth expectations in excess of analysts’ predictions.
In conclusion, factor investing allows investors to remove individual stock selection in favor of a process based investment method. AQR has successfully used factor investing to become one of the largest asset managers in the world.
Uniform accounting allows us to see through the fog, and identify how AQR’s Large Cap Defensive Style Fund is investing in high returns businesses.
SUMMARY and Walmart Inc. Tearsheet
As AQR Large Cap Defensive Style’s largest individual stock holding, we’re highlighting Walmart Inc.’s tearsheet today.
As the Uniform Accounting tearsheet for Walmart highlights, the Uniform P/E trades at 30.5x, which is above corporate average valuation levels but around its historical average valuations.
Low P/Es require low EPS growth to sustain them. In the case of Walmart, the company has recently shown a 21% Uniform EPS growth.
Wall Street analysts provide stock and valuation recommendations that in general provide very poor guidance or insight. However, Wall Street analysts’ near-term earnings forecasts tend to have relevant information.
We take Wall Street forecasts for GAAP earnings and convert them to Uniform earnings forecasts. When we do this, Walmart’s Wall Street analyst-driven forecast is a 3% shrinkage into 2020, before 5% growth into 2021.
Based on current stock market valuations, we can use earnings growth valuation metrics to back into the required growth rate to justify Walmart’s $133 stock price. These are often referred to as market embedded expectations.
The company needs to grow its Uniform earnings by 7% each year over the next three years and to justify current stock prices. What Wall Street analysts expect for Walmart’s earnings growth is below what the current stock market valuation requires in 2021.
Furthermore, the company’s earning power is above the corporate average. Also, cash flows are significantly above their total obligations—including debt maturities, capex maintenance, and dividends. Together, this signals low credit risk and dividend risk.
To conclude, Walmart’s Uniform earnings growth is above peer averages in 2020, and the company is trading below average peer valuations.
Best regards,
Joel Litman & Rob Spivey
Chief Investment Strategist &
Director of Research
at Valens Research