Portfolio churn can destroy value for investors, and for companies

One of the first questions that an investor generally asks when they’re talking to an asset allocator is “what is your portfolio churn.”
Investors worry that if a manager is constantly buying and selling stocks, transaction fees will hurt the performance of the portfolio. The act of churn will add extra costs to the portfolio, bringing down returns.
Investors are also worried that heavier churn means a manager needs to get more stocks right.
Warren Buffett talks about buying companies and holding them forever. When he does that, it means he just needs to get that name right once, and then if he’s right, he can reap the rewards for the rest of his life. If an investor is turning over his entire 30 stock portfolio every quarter, he needs to get 120 stocks right to make money. That’s a lot of work, and the law of averages says the larger his universe of stocks he’s investing in is, the more likely it is he’s going to be picking stocks that have market average returns.
And that’s before we even get into those pesky transaction fees.
That exact same issue occurs with companies.
GE is an excellent example of this. GE has bought and sold several key assets over the years, and almost always at the exact wrong time.
They sold NBC Universal just before the current content revolution, and sold GE Capital in the midst of the most challenging environment for financials over the past 50 years.
They bought Baker Hughes just before the peak of the oil market, and similarly invested in their infrastructure business before slower global economic growth.
United Technologies has done a better job than most at being a conglomerate. They were savvy in buying Rockwell Collins as aerospace got stronger.
But with their recent decision to spin off Otis and Carrier when global growth is weaker, just as they are purchasing Raytheon, when defense spending is at the higher end of historical levels, United Technologies may be making the exact churn missteps that they’ve been avoiding for years.
Investors don’t appear to be concerned about those potential issues, as they are expecting returns to continue to rise. However, with management concerned about their market outlook, the spin-offs, and their guidance, there could be downside risk going forward.
We’re Relaunching Our Portfolio Audit Review Offering – And Making A Special Offer
For our institutional clients, we don’t just provide access to our Valens Research app. We also do bespoke research. We produce one-off deep-dive company analyses using all our tools, including Uniform Accounting, credit work, and our management compensation and earnings call analysis. We monitor their portfolios for potential Uniform Accounting signals to alert them. We provide custom datasets for quantitative analysis, and provide aggregate analytics. We also help them create unique idea generation screens that are customized to their approach, using Uniform Accounting and our other analytics.
But for most of our institutional clients, the analysis that they find most useful, and almost universally ask for, is a quarterly portfolio audit and call with our analysts.
Our institutional clients pay a significant premium for all our bespoke research. Some of our institutional clients have paid well over $100,000 a year for our uniquely tailored Uniform Accounting research, because of the value it adds to their process.
Until Thanksgiving, we’re making a special offer.
For any investor that buys access to the Valens Research app ($10,000/year subscription), we will include an Institutional-level portfolio audit and call with our analyst team with no extra charge.
Also, for those people who sign up to the offer before end of day on November 15th, we’ll include one year of access to all of our newsletters, including our Market Phase Cycle™ and Conviction Long Idea List (a $6,000 value), for no extra charge.
We want to help show you how powerful Uniform Accounting research can be for your investment strategy.
If you want to hear more about this offer, or are interested in subscribing, feel free to reply to this email. I’ll forward your note to our head of client servicing. Or, feel free to reach out to Doug Haddad, the head of our client relations team, at doug.haddad@valens-securities.com or at 630-841-0683.
To read more about the offer and sign up, you can also click here.
Market expectations are for Uniform ROA expansion, but management may be concerned about EPS, sales, and market share
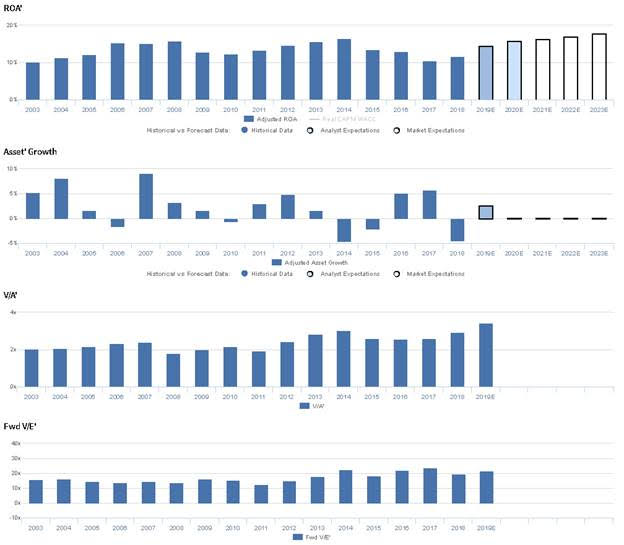
UTX currently trades near recent averages relative to UAFRS-based (Uniform) Earnings, with a 21.7x Uniform P/E. At these levels, the market is pricing in expectations for Uniform ROA to improve from 12% in 2018 to 18% in 2023, accompanied by immaterial Uniform Asset growth going forward.
Analysts have similar expectations, projecting Uniform ROA to expand to 16% by 2020, accompanied by 3% Uniform Asset growth.
UTX has historically seen cyclical profitability, as aircraft end market demand is dependent on the strength of the economy and the length of replacement cycles. From 2003-2008, Uniform ROA improved from 10% to 16%, before fading to 12% in 2010, and recovering to a peak of 17% in 2014. Since then, however, Uniform ROA has compressed to just 12% in 2018. Meanwhile, Uniform Asset growth has historically been muted, positive in 11 of the past 16 years, while ranging from -5% to 9%.
Performance Drivers – Sales, Margins, and Turns
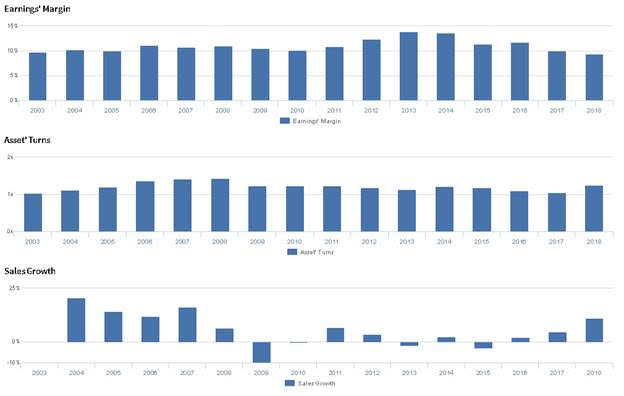
Cyclicality in Uniform ROA has been driven by trends in both Uniform Earnings Margin and Uniform Asset Turns. From 2003-2011, Uniform Margins remained stable at 10%-11% levels, before expanding to a high of 14% in 2013, and fading to 9% in 2018. Meanwhile, Uniform Turns improved from 1.0x in 2003 to a high of 1.4x in 2008, before fading to 1.1x-1.2x levels from 2009 to 2018. At current valuations, the market is pricing in expectations for expansion in both Uniform Margins and Uniform Turns, as UTX completes the spin-off of both Otis Elevator and the Carrier Corporation.
Earnings Call Forensics
Valens’ qualitative analysis of the firm’s Q3 2019 earnings call highlights that management is confident elevator cancellation rates are declining. However, they may lack confidence in their ability to sustain recent EPS growth and meet their revised margin guidance. Furthermore, they may be concerned about the sustainability of Collins performance and about the impact future trends in defense spending will have on their profitability. In addition, they may be concerned about the creditworthiness of Otis and Carrier, and they may be concerned about the impact a stronger dollar will have on global sales. Finally, they may lack confidence in their ability to effectively invest in digitalizing their business.
UAFRS VS As-Reported
Uniform Accounting metrics also highlight a significantly different fundamental picture for UTX than as-reported metrics reflect. As-reported metrics can lead investors to view a company to be dramatically stronger or weaker than real operating fundamentals highlight. Understanding where these distortions occur can help explain why market expectations for the company may be divergen
As-reported metrics significantly understate UTX’s profitability. For example, as-reported ROA for UTX was 5% in 2018, materially lower than Uniform ROA of 12%, making UTX appear to be a much weaker business than real economic metrics highlight. Moreover, since 2014, Uniform ROA has compressed from 17% to 12% in 2018, while as-reported ROA has actually remained stagnant at 5%-6% levels, directionally distorting the market’s perception of the firm’s recent profitability trends.
Today’s Tearsheet
Today’s tearsheet is for Cisco. Cisco trades at a discount to market average valuations. The company has historically had strong Uniform EPS growth, which is forecast to continue in 2020, before slowing in 2021. At current valuations, the market is expecting the company to actually see earnings shrinkage going forward. The company’s earnings growth is around peer average levels, as are valuations. The company has strong and improving profitability, and no risk to their healthy 2.9% dividend yield.
Regards,
Joel Litman
Chief Investment Strategist


