
Viking lessons for the modern investment world

In the beginning of 2020, we highlighted a “Tiger Cub” fund that was looking to a wide breadth of investments to stay relevant in a constantly changing market. Of course, the pandemic and its aftermath have flipped many traditional investing strategies on their heads, let alone ones working off the beaten path.
Now, more than 18 months later, let’s check back in on Viking Global to see how they have tweaked their strategy throughout the choppy waters of the pandemic and recovery.
In addition to examining the portfolio, we’re including a deeper look into the fund’s largest current holding, providing you with the current Uniform Accounting Performance and Valuation Tearsheet for that company.
Investor Essentials Daily:
Friday Portfolio Review
Powered by Valens Research
In the past two years, Viking Global has seen its fair share of calm and stormy market conditions. 2020 featured a sharp downturn, followed by huge gains for investors willing to ride out the down periods.
Then in the beginning of 2021, Viking Global was one of the hedge funds burned during the Gamestop (GME) and AMC (AMC) trading, down 7% in just a few weeks.
After coming out of these conditions, the portfolio has changed drastically. This is why we are returning to the fund to see if the strategy we outlined back in 2020 still holds.
————————————————————————————————————————
When the Vikings landed at Lindisfarne in 793 to raid the monastery there, it kicked off the Viking Age in Europe.
It was an age of terror for Western Europeans that lasted three centuries, as the Vikings went from raiders to controlling much of Britain and Ireland, to founding Normandy, and even controlling Sicily in the Mediterranian.
But the history of the Scandinavian seafarers goes much further back.
While the Western Europeans viewed this as a new terror sent from God to punish them, the reality is the Vikings had been trading and raiding across Russia and Eastern Europe, traveling all the way to Constantinople, for some time.
The farmers and fishermen from Denmark, modern Norway, and Sweden had a long-run relationship with both the sea and farming.
The Vikings became traders and raiders because, while they were focused on farming and fishing, those alone could not provide for their people as they grew. Also, a mini-Ice Age led to less productivity of their lands than normal.
The Vikings weren’t just raiding for the sake of raiding. They had to continue to provide for their people like they’d done historically.
Modern investors have had to do much the same, jumping into, and disrupting, new markets and pursuing new strategies to try to continue to generate the returns their investors expect.
One of those firms is a fund named after its founder’s ancestors. Ole Andreas Halvorsen was born in Norway, and partially took the name of the fund because of his heritage.
Halvorsen is a Tiger Cub. He was incredibly successful studying under Julian Robertson at Tiger Management, where he was a director of equities and on the supervisory board of the firm’s Jaguar Fund.
He left Tiger in 1999 before the fund closed down, starting Viking Global, which grew at one point to over $30 billion in assets under management. However, like all the Tiger Cubs, he has remained part of the network of Cubs that all share ideas and strategies, and themes for investing.
One of the things Robertson, Halvorsen, and all the Cubs took from Tiger Management’s downfall was the importance of not just focusing on absolute value when making investments, but understanding the fundamental themes driving the market and companies.
And one of the key trends that Halvorsen and the other Cubs focused heavily on during the second half of the 2010s was the growing importance of venture capital, and how many high-flying companies were waiting to enter public equity markets until the real gains had been made.
He understood he couldn’t generate the returns his investors had come to expect just playing in his legacy market, much as the Vikings couldn’t provide for their people without pushing out from their native lands.
So he and many of the other Cubs started to invest in venture capital opportunities along with his legacy equity investments, to supplement returns.
That being said, the vast majority of Viking’s portfolio, over $20 billion, remains in public equity investments, focused on the same kind of companies that Viking has always focused on, undervalued companies with strong fundamentals and macro tailwinds.
Analyzing Viking’s portfolio, it’s not obvious that the fund invests in either high-quality, undervalued names or companies with strong macro tailwinds when using as-reported metrics.
But we’ve conducted a portfolio audit of Viking’s top holdings, based on their most recent 13-F, and Uniform Accounting shows a very different picture.
We’re showing a summarized and abbreviated analysis of how we work with institutional investors to analyze their portfolios.
Unsurprisingly, while Viking’s investments’ as-reported metrics make it look like Viking has lost its way, in reality, they appear to be higher quality names, once Uniform Accounting metrics are reviewed.
See for yourself below.
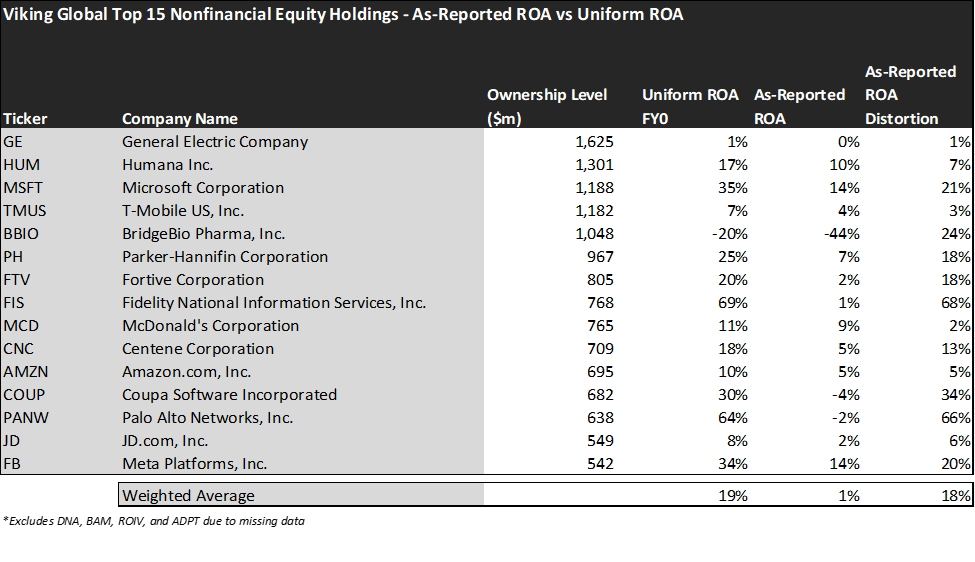 Using as-reported accounting, investors would think Viking was not focusing on companies with strong thematic tailwinds and fundamental upside.
On an as-reported basis, many of these companies are poor performers with returns below 6%, and with an average as-reported return on assets (ROA) of 1%.
In reality, the average company in the portfolio displays an impressive average Uniform ROA at 19%. That’s currently above corporate average returns.
Once we make Uniform Accounting (UAFRS) adjustments to accurately calculate earning power, we can see that the returns of the companies in Viking’s portfolio are much more robust.
Once the distortions from as-reported accounting are removed, we can realize that Palo Alto Networks (PANW) doesn’t have a -2% ROA, it is actually at a whopping 64%. Rather than a name bleeding value, it is a strongly profitable innovator.
Similarly, Fidelity’s (FTV) ROA is really at 69%, not 1% as GAAP would have you believe. While as-reported metrics are portraying the company as a low return distribution business, Uniform Accounting shows the company’s real robust operations.
The list goes on from there, for names ranging from Coupa Software (COUP) and BridgeBio Pharma (BBIO), to well-known names like Microsoft (MSFT), and Meta (FB).
If Viking were focused on as-reported metrics, it would never pick most of these companies because they look like anything but the high-quality companies with thematic tailwinds that are the fund group’s mandate.
But to find companies that can deliver alpha beyond the market, just finding companies where as-reported metrics mis-represent a company’s real profitability is insufficient.
To really generate alpha, any investor also needs to identify where the market is significantly undervaluing the company’s potential.
Viking is also investing in companies that the market has low expectations for, low expectations the companies can exceed.
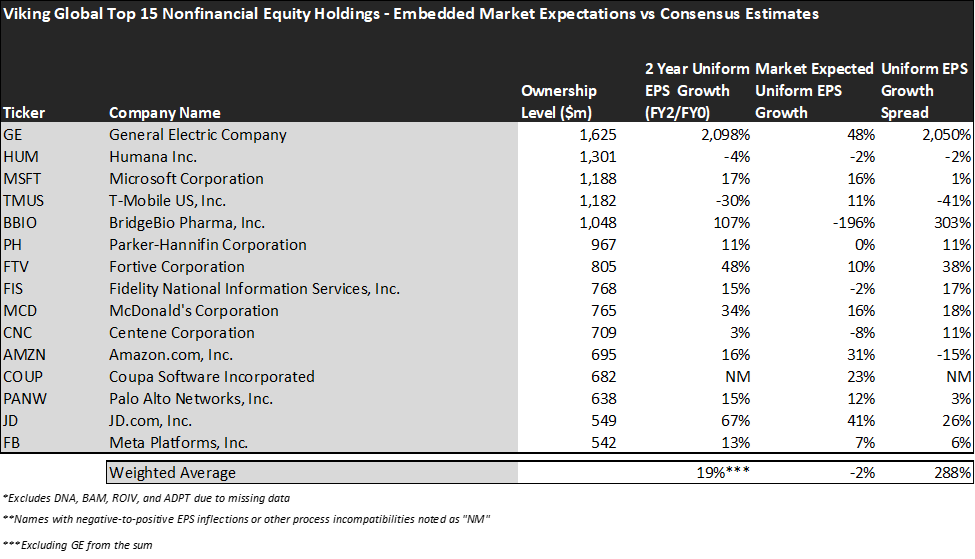
This chart shows three interesting data points:
- The 2-year Uniform EPS growth represents what Uniform earnings growth is forecast to be over the next two years. The EPS number used is the value of when we take consensus Wall Street estimates and we convert them to the Uniform Accounting framework.
- The market expected Uniform EPS growth is what the market thinks Uniform earnings growth is going to be for the next two years. Here, we show by how much the company needs to grow Uniform earnings in the next 2 years to justify the current stock price of the company. If you’ve been reading our daily analyses and reports for a while, you’ll be familiar with the term embedded expectations. This is the market’s embedded expectations for uniform earnings growth.
- The Uniform EPS growth spread is the spread between how much the company’s Uniform earnings could grow if the Uniform earnings estimates are right, and what the market expects Uniform earnings growth to be.
The average company in the US is forecast to have 5% annual Uniform Accounting earnings growth over the next 2 years. The median company in Viking’s holdings is forecast by analysts to outpace that, growing at 16% a year over the next 2 years. The average company is growing 19%, excluding the outlier of General Electric (GE).
Viking is not just finding high-quality companies with strong tailwinds though, it is finding mispriced companies.
On average, the market is pricing these companies to shrink earnings by 2% a year. While these companies are growing robustly, they are intrinsically undervalued, as the market is mispricing their growth by 21% on average.
These are the kinds of companies that are likely to see their stocks rally when the market realizes how wrong it is. Without Uniform numbers, the GAAP numbers would leave everyone confused. And the risk of returns collapsing is low, considering how high quality these companies are.
One example of a company in the Viking portfolio that has growth potential that the market is mispricing is BridgeBio Pharma. Wall Street analysts have forecast 107% Uniform earnings growth built in, but the market is pricing the company to have earnings shrink by 196% each year for the next two years.
Another company with similar dislocations is General Electric. Expectations are already high, for 48% growth in earnings. However, the company is actually forecast for Uniform EPS to grow by a whopping 2,098% a year.
That being said, there are a few companies we’d recommend Viking look at again before holding.
T-Mobile (TMUS) is forecast to see Uniform earnings shrink by 30% a year going forward. However, the market is pricing the company for 11% annual earnings growth, a steep premium.
This doesn’t look like an intrinsically undervalued company. If anything, the market looks significantly too bullish.
But many of Viking’s holdings look like a high quality, undervalued set of stocks with businesses displaying strong earning power. It wouldn’t be clear under GAAP, but unsurprisingly Uniform Accounting sees the same signals that Viking appears to focus on.
Despite the huge changes over the past 18 months, Viking Global is still able to create a value-accretive strategy.
SUMMARY and General Electric Company Tearsheet
As one of Viking Global’s largest individual stock holdings, we’re highlighting General Electric Company’s tearsheet today.
As the Uniform Accounting tearsheet for General Electric Company (GE:USA) highlights, its Uniform P/E trades at 25.5x, which is around the global corporate average of 24.0x, but below its own historical average of 60.2x.
Moderate P/Es require moderate EPS growth to sustain them. In the case of General Electric, the company has recently shown a 98% Uniform EPS decline.
Wall Street analysts provide stock and valuation recommendations that, in general, provide very poor guidance or insight. However, Wall Street analysts’ near-term earnings forecasts tend to have relevant information.
We take Wall Street forecasts for GAAP earnings and convert them to Uniform earnings forecasts. When we do this, General Electric’s Wall Street analyst-driven forecast is for EPS to expand significantly in 2021 and by 80% in 2022.
Based on the current stock market valuations, we can use earnings growth valuation metrics to back into the required growth rate to justify General Electric’s $96 stock price. These are often referred to as market embedded expectations.
The company is currently being valued as if Uniform earnings were to grow 48% annually over the next three years. What Wall Street analysts expect for General Electric’s earnings growth is above what the current stock market valuation requires both in 2021 and in 2022.
Meanwhile, the company’s earning power is below long-run corporate averages. That said, cash flows and cash on hand consistently exceed total obligations—including debt maturities, capex maintenance, and dividends. Together, these signal low credit and dividend risks.
Lastly, General Electric’s Uniform earnings growth is above peer averages, and the company is trading near its average peer valuations.
Best regards,
Joel Litman & Rob Spivey
Chief Investment Strategist &
Director of Research
at Valens Research