
Uniform Accounting shows how much the market misunderstands this pharmacy consolidator’s strategy, and why that’s presenting an opportunity

Today’s company is one of the world’s biggest pharmacy firms, created from the merger of two industry giants in 2014. However, looking at as-reported numbers, it appears the acquisition has destroyed value for the company.
UAFRS (Uniform) based analysis, on the other hand, shows the firm’s real performance, with the market and as-reported metrics missing the profitability of the firm.
Also below, Uniform Accounting Embedded Expectations Analysis and the Uniform Accounting Performance and Valuation Tearsheet for the company.
Investor Essentials Daily:
Tuesday Tearsheets
Powered by Valens Research
When focusing on acquisition targets, strategic acquirers look beyond only growing the business. Smart acquirers look for targets that can provide synergies, when the combined performance of two companies is greater than the sum of individual parts.
These benefits come in the form of cost or revenue synergies. Some examples of cost synergies are supply chain efficiencies, shared information technology and research and development overlap. The combined company can often cut many costs and share operations to achieve these goals.
For revenue synergies, the new company could grow its customer base beyond the two companies alone, or benefit from complementary products. Acquisitions open up cross-selling opportunities, and it can also open up brand new product or market innovation.
These synergies are not the only ones that can occur in acquisitions, but they are the most common. This is because they are the most straightforward benefits for investors to measure and for management to identify.
Other less obvious synergies include the idea of acquiring a competitor in a completely different market. This allows the acquirer to share costs and improve negotiations with suppliers, but the target must sell similar products.
One example of a merger that did not conform to conventional synergies was the 2014 Walgreens (WBA) acquisition of Boots. Walgreens was primarily an American business, while Boots was its British counterpart. The two companies had virtually no store overlap geographically and sourced products from different suppliers.
Walgreens previously owned 45% of Boots, and made the full acquisition in 2014, acquiring the remaining 55% for $10.7 billion. This expanded Walgreens presence to the European market and grew its customer base.
However, traditional synergistic benefits were not readily obvious. The offerings of the two companies were vastly different due to cultural differences, meaning different brands and suppliers, and different customer spending habits, which made it less clear how the new company could achieve cost synergies.
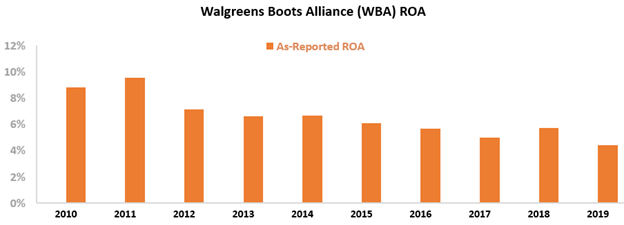
Due to the huge differences between Walgreens and Boots, investors were likely not surprised when as-reported returns on assets (ROA) declined in the wake of the merger.
ROAs first declined in 2012 from 10% to 7%, following Walgreens’ initial 45% purchase of Boots. Returns continued to decline after completion of the acquisition in 2014, falling further from 7% to 4% by 2019. Investors seeing this would reasonably assume Walgreens’ move to expand its operations has been detrimental to the firm’s performance.
However, this picture of Walgreen’s performance is inaccurate, pulled down by distortions in as-reported accounting. Due to the GAAP treatment of goodwill, among other distortions, the market has missed the mark on the success of the combined firm.
Walgreen’s acquisition of Boots has allowed it to become a global player in the pharmacy space and achieve significant synergies.
Walgreens was able to realize over $1 billion in synergies during 2016, because the reality is suppliers do overlap, even across the pond. The company created a generic purchasing office to buy products in bulk at a discount. While many individual brands are different by country, generic products can be utilized in different markets, and those different brands are often from the same supplier. The combined firm also saw benefits from supply chain efficiencies, as well as improved promotional effectiveness.
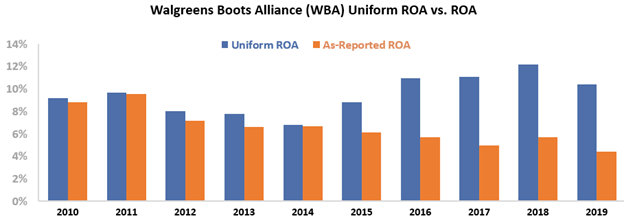
These benefits have led to a Uniform ROA for Walgreens over 2x higher than the as-reported numbers in 2019. In 2014, Uniform ROA and as-reported figures were nearly identical. They have since diverged following the completion of the merger. Uniform ROA’s expanded from 7% to 10%, while as-reported numbers dropped.
It is clear the market is not realizing the success of this merger, as the stock price has plummeted over 50% from $75 to $35. The failed acquisition of Rite Aid (RAD) in 2017 and the well-documented partnership with Theranos have also contributed to stock declines.
These factors, combined with investors skepticism of the Boots acquisition, have led to underperformance for Walgreens. Once the market realizes the benefits of the merger for Walgreens, the stock might change trajectory. The Boots purchase has not hurt returns, but rather has forged a global leader executing on cost and revenue synergies in the drugstore space.

Ultimately, Uniform Accounting shows the true strength of Walgreens’ business and the success of its 2014 acquisition of Boots.
Walgreens was able to expand its market share in the global pharmacy industry and experience synergistic benefits. The creation of the generic purchasing office and supply chain efficiencies have led to Uniform ROA expansion.
Without Uniform Accounting, investors would believe Walgreens has seen declining returns since the acquisition. Once the market realizes the true trajectory of Walgreen’s returns, the market’s outlook may change.
Walgreens Boots Alliance, Inc. Embedded Expectations Analysis – Market expectations are for Uniform ROA compression, and management may have concerns about their margins, growth, and demand
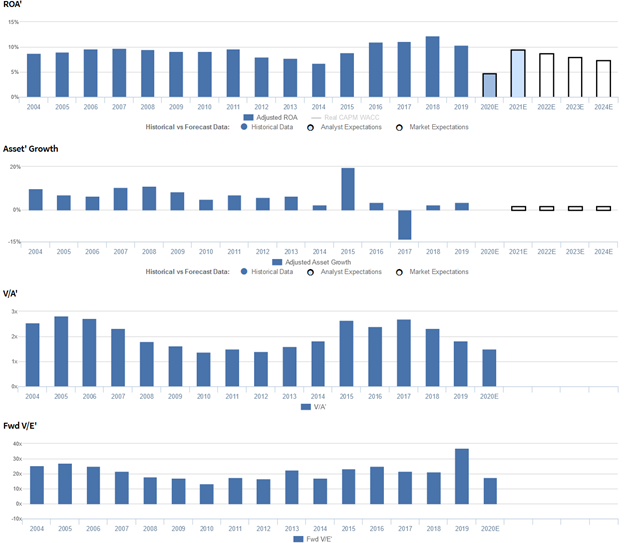
WBA currently trades below recent averages relative to Uniform earnings, with a 17.3x Uniform P/E (Fwd V/E′). At these levels, the market is pricing in expectations for Uniform ROA to fade from 10% in 2019 to 7% in 2024, accompanied by 2% Uniform asset growth going forward.
Meanwhile, analysts have less bearish expectations, projecting Uniform ROA to decline to 5% in 2020 amid coronavirus headwinds, before rebounding back to 10% in 2021, accompanied by immaterial Uniform asset growth.
Historically, WBA has seen moderate, stable profitability. Uniform ROA sustained 9%-10% levels from 2004-2011, before declining to 7% in 2014. Thereafter, following the 2015 acquisition of Alliance Boots, Uniform ROA expanded to a peak of 12% in 2018, before falling to 10% in 2019.
Meanwhile, Uniform asset growth has been mostly consistent, positive in fifteen of the past sixteen years, while ranging from 2%-11% since 2004, excluding 14% outlier shrinkage in 2017 and 20% growth in 2015 related to the aforementioned acquisition.
Performance Drivers – Sales, Margins, and Turns

Trends in Uniform ROA have been primarily driven by trends in Uniform asset turns, coupled with stable Uniform earnings margins.
After ranging from 2.0x-2.2x levels in 2004-2011, Uniform turns faded to 1.8x levels in 2013-2014 before expanding to 2.8x-2.9x peaks in 2018-2019.
Meanwhile, Uniform margins have remained at 4%-5% levels since 2004. At current valuations, markets are pricing in expectations for Uniform turns to regress to pre-merger levels, accompanied by continued stability in Uniform margins.
Earnings Call Forensics
Valens’ qualitative analysis of the firm’s Q3 2020 earnings call highlights that management is confident that their Chinese retail JV is performing very strongly with third quarter percentage sales growth being in the mid-30s, and that this particular JV has more than 5,700 stores.
Furthermore, they are also confident that the Finance for the Future program will help drive improved business outcomes.
However, management may lack confidence in their ability to sustain adjusted retail gross margin, improve script growth, and sustain adjusted operating income. They may also be overstating the position of their online business in the U.K., and they may have concerns about the potential of their neighborhood destination concept and the sustainability of government contributions and capex.
Moreover, they may lack confidence in their ability to sustain transaction growth and Find Care platform traffic. Management may also have concerns about the continued slowdown in the high street segment, the sustainability of omnichannel product and convenience services demand, and costs of increasing inventory levels.
In addition, they may lack confidence in their ability to keep their stores functional, improve their Transformational Cost Management Program, and continue reducing costs. Also, they may have concerns about their ability to leverage their resources to maintain their services, continue rapidly responding to the pandemic, and access physicians and pharmacists in a coordinated manner.
Finally, management may lack confidence in their ability to secure new investment opportunities, improve pharmacy margins, and personalize marketing to their customers.
UAFRS VS As-Reported
Uniform Accounting metrics also highlight a significantly different fundamental picture for WBA than as-reported metrics reflect.
As-reported metrics can lead investors to view a company to be dramatically stronger or weaker than real operating fundamentals highlight. Understanding where these distortions occur can help explain why market expectations for the company may be divergent.
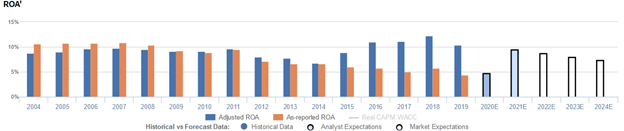
As-reported metrics significantly understate WBA’s recent profitability. For example, as-reported ROA for WBA was 4% in 2019, substantially lower than Uniform ROA of 10%, making WBA appear to be a much weaker business than real economic metrics highlight.
Moreover, since 2014, as-reported ROA has receded from 7% to 4% in 2019, while Uniform ROA has improved from 7% to 10% over the same time frame, directionally distorting the market’s perception of the firm’s profitability after the Alliance Boots acquisition.
SUMMARY and Walgreens Boots Alliance, Inc. Tearsheet
As the Uniform Accounting tearsheet for Walgreens Boots Alliance, Inc (WBA:USA) highlights, its Uniform P/E trades at 17.3x, which is below global corporate average valuation levels and its historical average valuations.
Low P/Es require low EPS growth to sustain them. In the case of Walgreens, the company has recently shown a 6% decline in Uniform EPS.
Wall Street analysts provide stock and valuation recommendations that in general provide very poor guidance or insight. However, Wall Street analysts’ near-term earnings forecasts tend to have relevant information.
We take Wall Street forecasts for GAAP earnings and convert them to Uniform earnings forecasts. When we do this, Walgreens’ Wall Street analyst-driven forecast an EPS decline of 59% in 2021, followed by an EPS growth of 144% in 2022.
Based on the current stock market valuations, we can use earnings growth valuation metrics to back into the required growth rate to justify Walgreens’ $35 stock price. These are often referred to as market embedded expectations.
The company can have Uniform earnings shrink by 6% each year over the next three years and still justify current prices. What Wall Street analysts expect for Walgrens’ earnings growth is below what the current stock market valuation requires in 2021, but exceeds that requirement in 2022.
Furthermore, the company’s earning power is 2x the corporate average. However, cash flows and cash on hand are below its total obligations—including debt maturities and capex maintenance. Together, this signals high credit and dividend risk.
To conclude, Walgreens’ Uniform earnings growth is well below peer averages. Therefore, as is warranted, the company is also trading well below peer values.
Best regards,
Joel Litman & Rob Spivey
Chief Investment Strategist &
Director of Research
at Valens Research