
This month’s screen turned out one of our favorite stock picks of the last five years

It’s no secret the world’s greatest investors view as-reported financial metrics as unreliable.
To consistently beat the market, they account for arbitrary accounting rules by adjusting the financial statements. This provides a true picture of economic reality and allows them to find companies that exhibit three characteristics: high quality, strong growth potential, and low valuations.
Today, we highlight our QGV 50, which emulates this investment strategy to produce outsized returns in excess of the market over long periods of time.
Today, we are taking a look at a company we found manually years ago, which naturally appeared on our QGV 50 screen, and why it is so compelling.
Also below, the company’s Uniform Accounting Performance and Valuation Tearsheet.
Investor Essentials Daily:
Tuesday Tearsheets
Powered by Valens Research
Throughout financial market history, many of the world’s most successful investors have been candid in their belief that Generally Accepted Accounting Principles (“GAAP”) distort economic reality.
Legendary value investor Marty Whitman, whose Third Avenue Management funds consistently beat the market over the past 20 years, once stated that “a lot of what Wall Street does has nothing to do with the underlying value of a business.”
Investors who neglect the very real issues with as-reported accounting can find themselves caught up investing with the crowd, blindly following hot “themes” without a thorough grasp of how to understand the businesses in question.
The only true way to mimic the success of greats like Whitman begins with developing a clear picture of how a business operates, something that can only be done by adjusting financial statements to reflect the arbitrary nature of certain accounting rules that leave much to discretion.
The world’s best investors understand the need to make these adjustments, which allows them to focus not on picking out the most popular companies, but rather looking for great names in sleepy areas that the market isn’t paying much attention to. From there, the goal is to then identify quality companies with significant growth potential at reasonable prices.
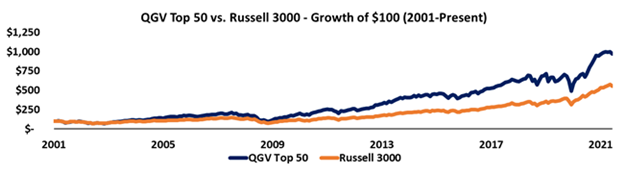
That’s exactly what we’ve set out to do with the QGV 50, our monthly list of 50 companies that rank at the top for high quality, high growth, and low valuations.
This list has outperformed the market by 300bps per year for over 20 years now, effectively doubling the performance of the market by focusing on the real fundamentals and valuations of companies with our proprietary Uniform Accounting framework.
See for yourself below.
A top QGV 50 name this month is Winnebago Industries (WGO), one of our favorite stocks of the past 5 years.
The company, which manufactures motorhomes and other types of recreational vehicles (“RVs”), was on our radar long before the pandemic struck and led demand for its products to skyrocket.
A big reason we initially loved the name was because Uniform Accounting allowed us to see the company’s true performance.
Winnebago’s Uniform return on assets (“ROA”) used to consistently lag its biggest competitor, Thor Industries (THOR).
Prior to 2017, Winnebago’s Uniform ROA was either in the single digits or negative nearly every year. Meanwhile, Thor’s returns were consistently sitting around 20% or higher.
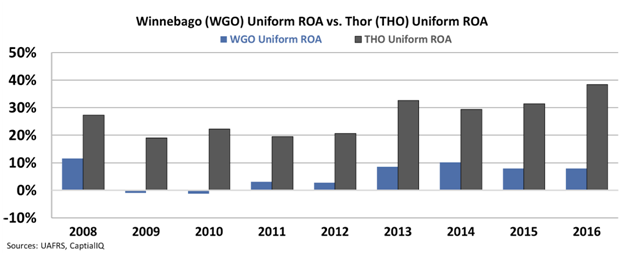
But a major shift occurred in 2016 when Winnebago acquired Grand Design, an RV business focused on making campers.
This acquisition massively transformed Winnebago’s profitability. Before the purchase, the company relied heavily on engineering prowess to build its complex motorhomes.
These types of RVs are not only living spaces on wheels, but they also have power trains. This means Winnebago required lots of assets to manufacture driving components.
Campers on the other hand have no power train—you don’t drive them. Instead, they can be attached to the back of a pickup truck or SUV with a specialized trailer.
This makes producing them much less complex and asset-intensive, meaning greater efficiency and higher asset turns.
In sum, Grand Design turned Winnebago from a motorhome heavyweight into a serious player in the much higher ROA camper business.
Part of the reason why Thor was a more profitable business for so long was precisely because it offered both types of products, motorhomes and campers.
Thanks to Uniform Accounting, we could see that Winnebago was becoming more like Thor. Only the market failed to grasp the transition, pricing in expectations for ROA to remain flat instead of inflect higher.
True to what we expected—because we understood the business dynamics at work—Winnebago saw an ROA plateau shift in 2017, from a measly 8% to an impressive 21%, even though as-reported metrics failed to capture it.
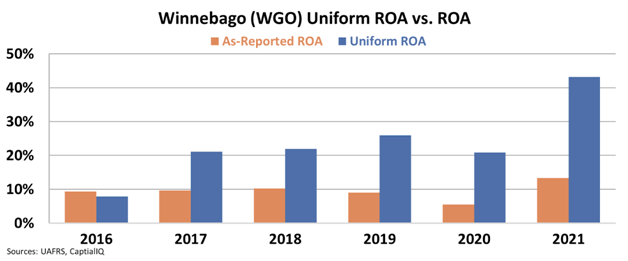
The company’s profitability inflection made perfect sense. It acquired a higher ROA business where it could be more efficient with its assets.
Smart investors understood this quite well, evidenced by Winnebago stock comfortably beating the market since the deal was closed.
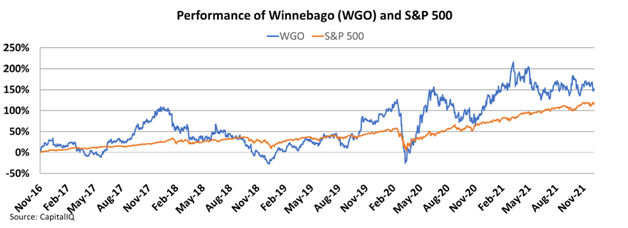
Then the pandemic struck in 2020 and ushered in a new era for the company.
With At-Home Revolution tailwinds at its back, Winnebago went from not just becoming more profitable, but also being able to significantly grow thanks to booming demand.
Despite robust returns and strong growth over the past few years, Winnebago is still valued inexpensively by the market. The company currently trades at a Uniform price-to-earnings ratio (“P/E”) of just 7.0x, hence why it’s included on this month’s QGV 50 list.
If it were easy to find great companies with growth potential trading at favorable prices, professional investors would be out of the job. And yet, with Uniform Accounting it is, and that’s why the QGV 50 has had such tremendous success beating the market over the years.
To learn more about the QGV 50 and see the other 49 companies on the list this quarter, click here to get full access today.
SUMMARY and Winnebago Industries, Inc. Tearsheet
As the Uniform Accounting tearsheet for Winnebago Industries, Inc. (WGO:USA) highlights, the Uniform P/E trades at 7.0x, which is below the global corporate average of 24.0x, but around its historical P/E of 8.0x.
Low P/Es require low EPS growth to sustain them. In the case of Winnebago, the company has recently shown a 227% Uniform EPS growth.
Wall Street analysts provide stock and valuation recommendations that in general provide very poor guidance or insight. However, Wall Street analysts’ near-term earnings forecasts tend to have relevant information.
We take Wall Street forecasts for GAAP earnings and convert them to Uniform earnings forecasts. When we do this, Winnebago’s Wall Street analyst-driven forecast is an 11% and 1% EPS growth in 2022 and 2023, respectively.
Based on the current stock market valuations, we can use earnings growth valuation metrics to back into the required growth rate to justify Winnebago’s $69 stock price. These are often referred to as market embedded expectations.
The company is currently being valued as if Uniform earnings were to shrink by 17% annually over the next three years. What Wall Street analysts expect for Winnebago’s earnings growth is above what the current stock market valuation requires through 2023.
Furthermore, the company’s earning power in 2021 is 7x above the long-run corporate average. Moreover, cash flows and cash on hand are 4x its total obligations—including debt maturities, capex maintenance, and dividends. All in all, this signals a low credit and dividend risk.
Lastly, Winnebago’s Uniform earnings growth is below its peer averages, but the company is trading above its average peer valuations.
Best regards,
Joel Litman & Rob Spivey
Chief Investment Strategist &
Director of Research
at Valens Research