
Why this charitable foundation is back in the spotlight

With the recent separation of Bill and Melinda Gates, many people are wondering what will happen with the foundation they have created together and its collective assets.
With such a lasting impact on treating various diseases and supporting developing countries, we want to look into how it will continue to operate.
In addition to examining the portfolio, we’re including a deeper look into the fund’s largest current holding, providing you with the current Uniform Accounting Performance and Valuation Tearsheet for that company.
Investor Essentials Daily:
Friday Uniform Portfolio Analytics
Powered by Valens Research
With the news that Bill & Melinda Gates are heading their separate ways, one of the biggest topics that has come into focus from all of this is their massive amount of wealth being used for philanthropic efforts.
Furthermore, people are curious about how this wealth and support for charity will be impacted by the separation.
However, the former couple shed some light on this weighty topic.
Both Bill and Melinda Gates said they are going to continue to work together on the foundation, previously held under a structure called “Cascade”.
Now, their efforts will be named the Bill & Melinda Gates Foundation Asset Trust.
The reason this is such an important discussion regarding the couple’s separation is because of the Foundation’s impact over the years, having donated billions of dollars to help various causes.
The Foundation has created tremendous value for the world, from its war on malaria to helping improve education and healthcare in the developing world.
By looking at the fund’s holdings, people can begin to understand how the trust has thought about excess asset allocation to ensure its mission can continue throughout the foreseeable future.
Often its investments are not necessarily the biggest potential “rocket ship” companies that could shoot even higher.
Instead, it is invested in equities that have long-term assets that match its long-term aspirations on improving the world.
But just matching companies with long-term holdings alone won’t be enough for it to create value for the foundation, so let’s look at if the companies are also good, when looking at it from a Uniform Accounting framework.
See for yourself below.
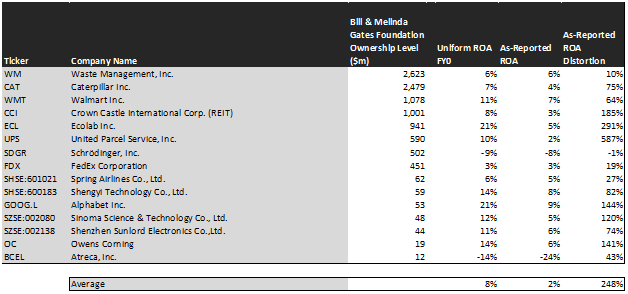
Using as-reported accounting, investors might think The Gates Foundation is buying names with extremely weak returns. In reality, The Foundation sees through the accounting noise to pick up strong performers the market is missing, often because of accounting issues.
On an as-reported basis, many of these companies are poor performers with returns below 5%-6%, and the average as-reported ROA is around 2%.
However, once we make Uniform Accounting (UAFRS) adjustments to accurately calculate earning power, we can see that the returns of the companies in the Bill and Melinda Gates Foundation portfolio are more robust.
The average company in the portfolio displays an average Uniform return on assets (ROA) at 8%. This is well above the as-reported returns.
Once the distortions from as-reported accounting are removed, we can realize that Ecolab (ECL) doesn’t have an ROA of 5%, but returns of 21%. Ecolab isn’t a low-return company, it is a company with robust cash flows that the Foundation thinks is misunderstood by equity investors.
Similarly, Atreca’s (BCEL) ROA is really -14%, not -24%. The Foundation’s focus on better accounting recognizes a business not in quite as dire straits as it appears.
Alphabet (GOOGL) is another great example of as-reported metrics mis-representing the company’s profitability.
Google’s ROA isn’t 9%, it’s actually 21%. Uniform Accounting lines up with The Foundation’s decision making, Google is really a high return business.
The list goes on from there, for names ranging from Owens Corning (OC) and Crown Castle International (CCI), to Caterpillar (CAT) and Spring Airlines (SHSE:601021).
If The Foundation’s investment strategy was powered by as-reported metrics, it would never pick most of these companies, because they look like bad companies and poor investments.
To find companies that can deliver alpha beyond the market, just finding companies where as-reported metrics mis-represent a company’s real profitability is insufficient.
To really generate alpha, any investor also needs to identify where the market is significantly undervaluing the company’s potential.
The Bill and Melinda Gates Foundation is also investing in companies that the market has low expectations for, low expectations the companies can exceed.
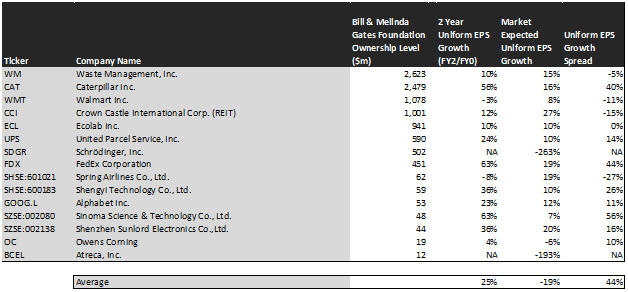
This chart shows three interesting data points:
- – The first datapoint is what Uniform earnings growth is forecast to be over the next two years, when we take consensus Wall Street estimates and we convert them to the Uniform Accounting framework. This represents the Uniform earnings growth the company is likely to have, the next two years.
- – The second datapoint is what the market thinks Uniform earnings growth is going to be for the next two years. Here, we are showing how much the company needs to grow Uniform earnings in the next 2 years to justify the current stock price of the company. If you’ve been reading our daily and our reports for a while, you’ll be familiar with the term embedded expectations. This is the market’s embedded expectations for Uniform earnings growth.
- – The final datapoint is the spread between how much the company’s Uniform earnings could grow if the Uniform Accounting adjusted earnings estimates are right, and what the market expects Uniform earnings growth to be.
The average company in the U.S. is forecast to have 5% annual Uniform Accounting earnings growth over the next 2 years. The Foundation’s holdings are forecast by analysts to grow by 25%, well above the average.
Even better, the market is pricing these companies to actually shrink earnings by 19% a year on average. While these companies are growing faster than the market, they are intrinsically undervalued, as the market is mispricing their growth by 44%.
One example of a company in the Bill and Melinda Gates portfolio that has growth potential that the market is mispricing is Caterpillar. Caterpillar’s analyst forecasts have 56% Uniform earnings growth built in, but the market is pricing the company to have earnings only grow by 16% each year for the next two years.
Another company with similar dislocations is Sinoma Science & Technology (SZSE:002080).
Market expectations call for a 7% growth in earnings. However, the company is actually forecast for Uniform EPS to grow by 63% a year, a strong growth expectation that will positively surprise the market.
Yet another is Shengyi Technology (SHSE:600183). The company is priced for 10% growth in Uniform earnings, when they are really forecasted to grow by earnings by 36% a year.
For the most part, Bill and Melinda Gates holdings are high quality, undervalued portfolios with businesses displaying strong earning power. This wouldn’t be clear under GAAP, but unsurprisingly Uniform Accounting and a system built to invest in robust, long-term value see the same signals.
SUMMARY and Waste Management Tearsheet
As Bill & Melinda Gates Foundation’s largest individual stock holding, we’re highlighting Waste Management’s tearsheet today.
As our Uniform Accounting tearsheet for Waste Management (WM:USA) highlights, Waste Management’s Uniform P/E trades at 38.3x, which is above the corporate average valuation of 23.7x and its own historical valuation of 33.5x.
High P/Es require high EPS growth to sustain them. In the case of Waste Management, the company has recently shown a 5% contraction in Uniform EPS.
Wall Street analysts provide stock and valuation recommendations that in general provide very poor guidance or insight. However, Wall Street analysts’ near-term earnings forecasts tend to have relevant information.
We take Wall Street forecasts for GAAP earnings and convert them to Uniform earnings forecasts. When we do this, Waste Management’s Wall Street analyst-driven forecasts are a 12% and 9% EPS growth in 2021 and 2022, respectively.
Based on current stock market valuations, we can back into the required earnings growth rate that would justify Waste Management’s $140 per share. These are often referred to as market embedded expectations.
The company is currently being valued as if Uniform earnings were to grow by 16% annually over the next three years. What Wall Street analysts expect for Waste Management earnings growth below what the current stock market valuation requires in 2021 and 2022.
Furthermore, the company’s earning power is in line with the corporate average. In addition, cash flows and cash on hand are below its total obligations—including debt maturities, capex maintenance, and dividends. However, the company’s intrinsic credit risk is only 60bps above the risk free rate. Together, this signals a high dividend risk and low credit risk.
To conclude, Waste Management’s Uniform earnings growth is above its peer averages, therefore, as is warranted their valuations are also traded above its average peers.
Best regards,
Joel Litman & Rob Spivey
Chief Investment Strategist &
Director of Research
at Valens Research


