
With this Hedge Fund demonized in the press for its GameStop short, we are taking a closer look

While this hedge fund was the wrong side of history regarding the GameStop fiasco, it has many quality long-term positions.
Today, we look at how a hedge fund manager we’ve worked with in the past has generated strong returns, despite being demonized in the press for their recent GameStop trade.
In addition to examining the portfolio, we’re including a deeper look into the fund’s largest current holding, providing you with the current Uniform Accounting Performance and Valuation Tearsheet for that company.
Investor Essentials Daily:
Friday Uniform Portfolio Analytics
Powered by Valens Research
The past few weeks in the market have been a whirlwind. The massive short squeezes have been the talk of Wall Street. News around GameStop (GME) captured the attention of investors and laypeople alike.
One firm at the heart of this mania is Melvin Capital, a hedge fund founded in 2014. Unfortunately, the hedge fund was holding short positions in GameStop throughout the short squeeze.
As GameStop’s price rocketed in the market, Melvin’s position kept getting worse. In fact, the firm had to access outside capital in order to survive and remain solvent.
Eventually, short sellers like Melvin were forced to close their positions. This meant they were buying back the stock at inflated prices, further driving up GameStop.
Valens Research actually worked with Gabriel Plotkin, the founder of Melvin Capital, back when he worked at SAC Capital under Steve Cohen.
Plotkin was an intelligent and thoughtful investor when we worked with him, as we are sure he still is. However, no investor has a spotless record. The fund was wrong to expose itself so far in its short position.
Outside of this trade, Melvin Capital has a consumer-tilted focus.
Like many other well-known hedge funds, Melvin Capital normally looks to hold long positions in higher quality and higher growth names, very similar to the type of quality, growth, and value signals we look for in our QGV 50.
Furthermore, the fund seeks out short positions in companies it believes are in secular declines or trading at inflated valuations.
Unfortunately, when the stock price of a fund’s short rockets higher, it’s the high quality names in the portfolio that often suffer the most.
This can create a dynamic similar to the great “quant crash” in the middle of 2008.
When funds like Melvin Capital are forced to cover their shorts, they have to sell out of their long positions for liquidity. This means their long positions often come crashing down due to a huge sell order pressuring prices.
With this trend in mind, it may be useful to look into Mevlin’s current holdings and highlight which names look interesting using Uniform Accounting. Some of Melvin’s current holdings may be trading at a discount simply because the fund was forced to sell.
To show the variances between as-reported and Uniform accounting, we’ve conducted a portfolio audit of Melvin’s top equity holdings, based on its most recent 13-F, focusing on its non-financial company holdings.
We’re showing a summarized and abbreviated analysis of how we work with institutional investors to analyze their portfolios.
Uniform Accounting metrics highlight the fund’s equity investments are much higher quality, and have higher potential, than the market and as-reported metrics imply.
See for yourself below.
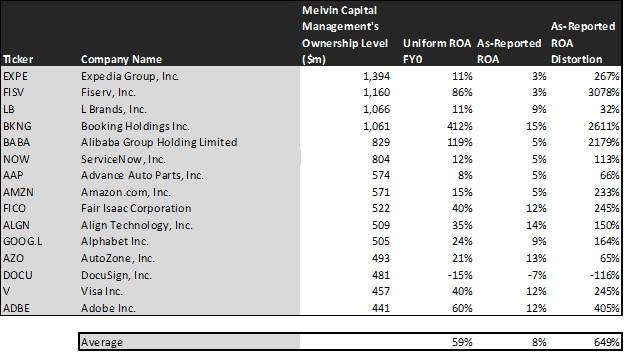
On an as-reported basis, many of these companies are poor performers, with returns near the cost-of-capital of 5% and the average as-reported ROA for the fund around 8%.
However, once we make Uniform Accounting (UAFRS) adjustments to accurately calculate earning power, we can see that the returns of the companies in Melvin’s portfolio are much more robust.
The average company in the portfolio displays an impressive average Uniform return on assets (ROA) at 59%. This is well above even corporate average returns.
Once the distortions from as-reported accounting are removed, we can realize that Fiserv (FISV) doesn’t have an ROA of 3%, but returns of 86%. Fiserv isn’t a low-return business, it is a company with robust cash flows that Melvin thinks is misunderstood by both equity and credit investors.
Similarly, Booking Holdings (BKNG) has a Uniform ROA of 412%, not 15%. Melvin’s focus on better accounting and credit analytics recognizes a high return business with cash flows to handle obligations.
Alibaba Group (BABA) is another great example of as-reported metrics mis-representing the company’s profitability.
Alibaba’s ROA isn’t 5%, it’s actually 119%. Uniform Accounting lines up with Melvin’s decision making, showing BABA is really a high return business with the ability to service its credit obligations.
The list goes on from there, for names ranging from ServiceNow (NOW) and Align Technology (ALGN), to Visa (V) and Amazon (AMZN).
If Melvin’s investment strategy was powered by as-reported metrics, it would never pick most of these companies, because they look like bad companies and poor investments.
To find companies that can deliver alpha beyond the market, just finding companies where as-reported metrics mis-represent a company’s real profitability is insufficient.
To really generate alpha, any investor also needs to identify where the market is significantly undervaluing the company’s potential.
Now, let us see how these firms’ returns can strengthen over time through EPS growth. Examining EPS growth and market expectations can help shed light on whether appreciation can continue.

This chart shows three interesting data points:
- The 2-year Uniform EPS growth represents what Uniform earnings growth is forecast to be over the next two years. The EPS number used is the value of when we take consensus Wall Street estimates and we convert them to the Uniform Accounting framework.
- The market expected Uniform EPS growth is what the market thinks Uniform earnings growth is going to be for the next two years. Here, we show by how much the company needs to grow Uniform earnings in the next 2 years to justify the current stock price of the company. If you’ve been reading our daily analyses and reports for a while, you’ll be familiar with the term embedded expectations. This is the market’s embedded expectations for Uniform earnings growth.
- The Uniform EPS growth spread is the spread between how much the company’s Uniform earnings could grow if the Uniform earnings estimates are right, and what the market expects Uniform earnings growth to be.
The average company in the U.S. is forecast to have 5% annual Uniform Accounting earnings growth over the next 2 years. Melvin’s holdings are forecast by analysts to grow by 3%, below average.
The market is pricing these companies to grow earnings by 18% a year on average. Even though these companies are growing slower than the market expects, they generate robust profitability levels.
One example of a company with high growth potential is Alibaba (BABA). While the market expects Alibaba to grow by 22% over the next two years, analysts forecast the firm to see 30% growth over the same period.
Another example is Docusign (DOCU). The company is priced for Uniform earnings to grow by 87%, but the company is forecasted to in fact grow its EPS by 91% in the next two years.
That being said, there are many companies forecast to have earnings growth less than market expectations. For these companies, like Expedia Group (EXPE), ServiceNow (NOW), and Fiserv (FISV), the market has growth expectations in excess of analysts’ predictions.
That being said, sometimes investors miss what Uniform Accounting is picking up, or in Melvin’s case, the fund might be betting on specific events for the company that make earnings forecasts less relevant.
For the most part, Melvin’s holdings are high quality, undervalued portfolios with businesses displaying strong earning power. In the aggregate, Melvin has invested in sound long ideas, highlighting investors should be looking for attractive valuations to take advantage of any falls.
SUMMARY and Expedia Group, Inc.’s Tearsheet
As Melvin Capital Management LP’s largest individual stock holding, we’re highlighting Expedia Group’s tearsheet today.
As the Uniform Accounting tearsheet for Expedia Group, Inc. (EXPE:USA) highlights, Expedia Group’s Uniform P/E trades at -36.4x, which is below the corporate average valuation of 25.2x, and its own historical valuation of -2.1x.
Low P/Es require low EPS growth to sustain them. In the case of Expedia Group, the company has recently shown a 21% Uniform EPS decline.
Wall Street analysts provide stock and valuation recommendations that in general provide very poor guidance or insight. However, Wall Street analysts’ near-term earnings forecasts tend to have relevant information.
We take Wall Street forecasts for GAAP earnings and convert them to Uniform earnings forecasts. When we do this, Expedia Group’s Wall Street analyst-driven forecasts are 423% and 90% EPS decline in 2020 and 2021.
Based on current stock market valuations, we can back into the required earnings growth rate that would justify $141.40 per share. These are often referred to as market embedded expectations.
The company can have Uniform earnings grow by 11% each year over the next three years and still justify current price levels. What Wall Street analysts expect for Expedia Group’s earnings growth is below what the current stock market valuation requires in 2020 and 2021.
Furthermore, the company’s earning power is 2x the corporate average. Also, cash flows and cash on hand are almost 2x its total obligations—including debt maturities, capex maintenance, and dividends. Together, this signals average credit and dividend risk.
To conclude, Expedia Group’s Uniform earnings growth is well below its peer averages, while their valuations are also well below its average peers.
Best regards,
Joel Litman & Rob Spivey
Chief Investment Strategist &
Director of Research
at Valens Research