
You might have planned on shorting this company using as-reported metrics, Uniform Accounting says cover your short position

Despite being an Internet of Things pioneer, this firm has recently faced increased competition and reduced growth opportunities, leading to a tumble in profitability.
While a lofty as-reported P/E may indicate a potential short candidate, TRUE UAFRS-based (Uniform) analysis shows that markets already recognize the potential headwinds for the firm, and have priced in further profitability deterioration.
Management’s concerns suggest pessimistic market expectations are reasonable but already priced in.
Also below, Uniform Accounting Embedded Expectations Analysis and the Uniform Accounting Performance and Valuation Tearsheet for the company.
Investor Essentials Daily:
Thursday Tearsheets
Powered by Valens Research
The “Internet of Things,” or IoT, has been a trendy buzzword in the world of technology for a while.
It offers unmatched connectivity of computing devices via the internet. Devices that send and receive data embedded in everyday household objects, such as a thermostat, security camera, or refrigerator.
While IoT has been a concept for many years, recent trends have made its use more prevalent. As processor chips become smaller, and with more and more people become comfortable with technology permeating their lives, houses have become more wired and connected via IoT.
Many view Nest’s line of thermostats, security cameras, and alarm systems to be among the first IoT products that entered people’s homes. For others, devices such as Amazon’s Alexa or Google’s Home were their first taste of the potential of an IoT future.
However, one of the first widespread IoT assets to enter homes en masse was a product many would not expect, the Roomba by iRobot Corporation (IRBT). Yes, the vacuum cleaner.
iRobot has been able to establish an extremely successful business off the heels of their marquee product. It has solidified itself as a leader in the industry, and has fended off smaller off-brand competitors using the slogan “If it’s not from iRobot, it’s not a Roomba”.
Much of the product’s appeal lies in its potential. Aside from being able to vacuum in specific places and times, Roomba’s ability to move freely around a home is an ability that few, if any, other IoT products have.
As such, Google has recently struck a partnership with the firm to explore Roomba’s IoT applications. Many other high-profile technology firms have been rumored to be interested in working with iRobot, as well.
The Roomba can be used as a house layout explorer and its spatial awareness can help improve the effectiveness and attractiveness of other IoT offerings.
For starters, it can flag areas with poor WiFi reception, providing homeowners with knowledge to find ways to expand their network to meet their requirements. It also can help identify more productive locations for thermostats or connected cameras. The potential is seemingly limitless.
As a result of the excitement surrounding iRobot’s continued IoT innovation, the firm appears to be trading at a slight premium, with a 21.3x as-reported P/E. However, given the firm’s recent profitability trends, this may seem unwarranted.
The firm’s Uniform ROA has fallen from 23% in 2018 to 16% in 2019, and is slated to decline even further to a forecasted 10% Uniform ROA through 2021. Based on its as-reported P/E, the market looks to be overly bullish on a firm that’s actually breaking down.
However, when looking at Uniform Accounting based valuations, we can get a clearer picture of the market’s expectations. In reality, iRobot is trading at below corporate average valuation levels, with a Uniform P/E of 14.9x.
This suggests that the market recognizes the reasons why the firm’s profitability has faltered and acknowledges that iRobot may face continued fundamental headwinds going forward.
Investors may have concerns about increased competition for the firm, specifically at lower price points, and dwindling growth opportunities. But they are already pricing that in.
As such, what may have looked like an overhyped short candidate using as-reported metrics becomes a firm that is already priced for a profitability collapse when applying a Uniform Accounting filter.
Thus, even as management may have concerns about growth opportunities, margins, and a production ramp-up, the market does not seem to be wrong. It seems to be validated.
When investors pay more attention to economic reality as opposed to distorted as-reported accounting analysis, they get a better understanding of the true market expectations for any given firm.
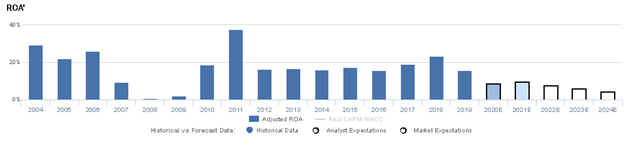
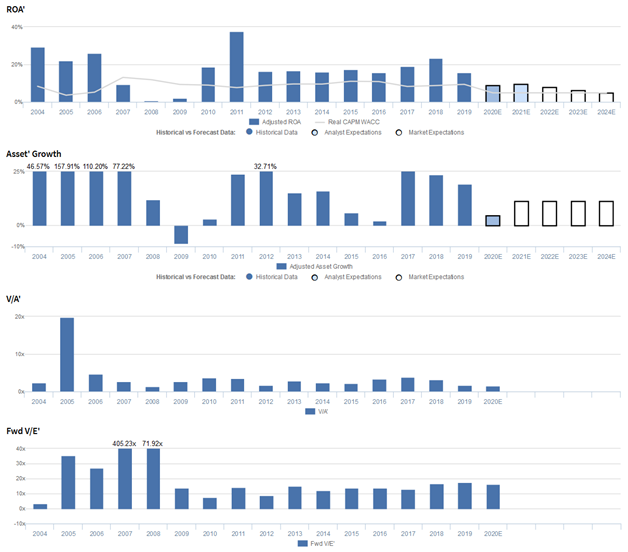
iRobot Corporation Embedded Expectations Analysis – Markets expect significant Uniform ROA declines, and management may be concerned about growth and margins
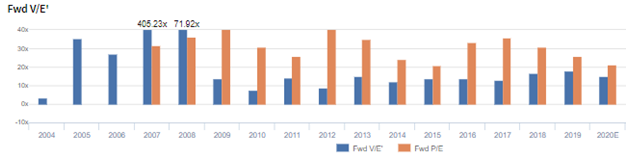
IRBT currently trades around historical valuations relative to earnings with a 14.9x Uniform P/E (Fwd V/E′).
At these levels, the market is pricing in expectations for Uniform ROA to decline from 16% in 2019 to 4% in 2024, accompanied by 11% Uniform asset growth.
Meanwhile, analysts have similar expectations, projecting Uniform ROA to decrease to 10% through 2021, accompanied by 5% Uniform asset growth.
iRobot has seen robust, generally cyclical profitability, with robust Uniform ROA ranging from 22% to 29% in 2004-2006, before collapsing to 1% in 2008.
Thereafter, Uniform ROA reached a peak of 38% in 2011, before falling to 16%-17% levels through 2016, rebounding to 23% in 2018, and regressing to 16% in 2019.
Meanwhile, IRBT has seen fairly robust Uniform asset growth, positive in fifteen of the past sixteen years, while ranging from -9% to 158%.
Performance Drivers – Sales, Margins, and Turns
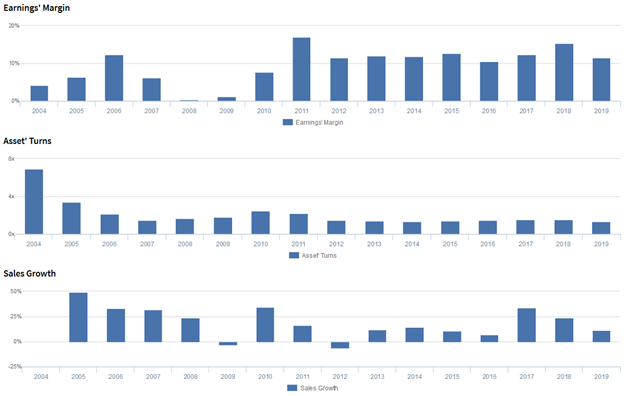
Historically, improvements in Uniform ROA have been driven by improvements in Uniform earnings margins, partially offset by declines in Uniform asset turns.
From 2004 to 2006, Uniform earnings margins improved from 4% to 12%, before falling to 0% in 2008. Then, Uniform earnings margins rose to 17% in 2011 and subsequently fell to 11%-13% levels from 2012-2017, before improving to 15% in 2018 and compressing once again to 11% in 2019.
Meanwhile, Uniform asset turns declined from 6.9x in 2004 to 1.5x in 2007, before gradually improving to 2.4x in 2010. Thereafter, Uniform asset turns faded to 1.4x-1.5x levels from 2013 to 2019.
At current valuations, market expectations are for both Uniform earnings margins and Uniform asset turns to fall significantly.
Earnings Call Forensics
Valens’ qualitative analysis of the firm’s Q4 2019 earnings call highlights that management may lack confidence in their ability to grow their connected user base, maintain their revenue growth cadence, and increase their international RVC market penetration.
Moreover, they may be concerned about their investments in reducing COGS, competition at lower price points, and the results of their leasing trial in Japan.
In addition, management may be exaggerating their ability to ramp-up production in Malaysia and drive innovation, and they may lack confidence in their ability to integrate with other Smart Home devices and continue to convert increased consumer engagement into higher in-app and irobot.com sales.
UAFRS VS As-Reported

Uniform Accounting metrics highlight a significantly different fundamentals picture for IRBT than as-reported metrics reflect.
As-reported metrics can lead investors to view a company to be dramatically stronger or weaker than real operating fundamentals highlight.
Understanding where these distortions occur can help explain why market expectations for the company may be divergent.
As-reported metrics significantly understate IRBT’s profitability.
For example, as-reported ROA for IRBT was 6% in 2019, materially lower than Uniform ROA of 16%, making IRBT appear to be a much weaker business than real economic metrics highlight.
Moreover, as-reported ROA has remained stable at 6%-9% levels since 2014, while Uniform ROA has been stable from 16% to 23% levels over the same time period, distorting the market’s perception of the firm’s historical profitability trends.
SUMMARY and iRobot Corporation Tearsheet
As the Uniform Accounting tearsheet for iRobot Corporation (IRBT) highlights, the firm trades at a 14.9x Uniform P/E, which is below corporate average valuation levels, but arounds its own recent history.
Low P/Es require low EPS growth to sustain them. In the case of iRobot, the company has recently shown Uniform EPS shrinkage of 18%.
Wall Street analysts provide stock and valuation recommendations that in general provide very poor guidance or insight. However, Wall Street analysts’ near-term earnings forecasts tend to have relevant information.
We take Wall Street forecasts for GAAP earnings and convert them to Uniform earnings forecasts. When we do this, iRobot’ Wall Street analyst-driven forecast is for a 40% Uniform EPS shrinkage in 2020, followed by a robust 22% Uniform EPS growth in 2021.
Based on current stock market valuations, we can back into the required earnings growth rate that would justify $43 per share. These are often referred to as market embedded expectations. In order to meet current market valuation levels, iRobot would only have to have Uniform earnings decline by 15% each year over the next three years.
What Wall Street analysts expect for iRobot’s earnings growth is above what the current stock market valuation requires.
Meanwhile, the company’s earnings power is 3x corporate averages, but despite their robust cash flows and cash on hand, there is still moderate risk to the company’s operations and credit profile.
To conclude, Amazon’s Uniform earnings growth is in line with peer averages. However, the company is trading at above average peer valuations.
Best regards,
Joel Litman & Rob Spivey
Chief Investment Strategist &
Director of Research
at Valens Research


