
J.C. Penney’s Credit Profile Is Too Discounted
Summary
- J.C. Penney’s credit risk is grossly overstated by credit markets.
- CDS is at 865bps versus Intrinsic CDS at 253bps, while cash bond YTW is at 10.570% compared to an Intrinsic YTW of 3.900%.
- Moody’s is also overstating credit risk with its Caa1 rating, treating the company’s credit as having substantial risks.
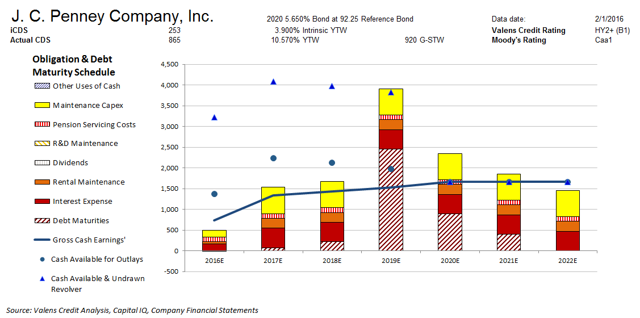
- However, all of JCP’s operating and debt obligations should be covered in the next few years, giving them time to refinance their debt maturities that start in 2019.
Cash Flow Profile
Credit markets are grossly overstating the credit risk of J.C. Penney Company, Inc. (NYSE:JCP). CDS is at 865bps compared to an Intrinsic CDS of only 253bps, while cash bond YTW is at 10.570% relative to an Intrinsic YTW of 3.900%. Credit markets may be overlooking JCP’s current substantial liquidity, which gives them a multi-year runway to solve profitability issues before they face their next material debt headwall in 2019.
Moody’s is also overstating JCP’s credit risk with a Caa1 credit rating three notches too high. Valens rates JCP at HY2+, or a highly speculative B1 equivalent using Moody’s ratings scale.
This analysis uses Uniform Adjusted Financial Reporting Standards (UAFRS) metrics, or adjusted metrics, which remove accounting distortions found in GAAP and IFRS to reveal the true economic profitability of a firm. This allows us to better understand the real historic economic profitability of a firm as well as allows for better comparability between peers. To better understand UAFRS, please refer to our explanation here.
The chart provides a far more comprehensive view of credit fundamentals than traditional ratio-based analyses. By using Uniform Adjusted Financial Reporting Standards based metrics, it shows the cash flow generation and cash obligations related to the credit of the firm, adjusted for non-cash financial statement reporting distortions from GAAP. The blue line indicates the gross cash earnings (UniformFRS adjusted cash flow number) expected to be generated based on consensus analyst estimates and Valens Research’s own in-house research team. The blue dots above that line include the cash available at that time while the blue triangles indicate that same amount plus any existing, available lines of credit.
The colored, stacked bars show the cash obligations of the firm in each year forecast. The most difficult obligations to avoid are at the bottom of each stack, such as interest expense. The obligations with more flexibility to defer year to year, such as pension contributions and maintenance capital expenditures, are at the top of the stacked bars. All of the calculations are adjusted for non-cash distortions that are inherent in GAAP accounting, including the highly problematic and often misused statement of cash flows.
Click here to read the article in its entirety at Seeking Alpha.


