
Kansas City Southern’s Concerns About Growth Imply Investors Are Too Bullish
Summary:
- Markets expect KSU’s Adjusted ROA levels to expand, but management’s concerns about top- and bottom-line growth imply that this may be unwarranted.
- KSU is trading at a 1.8x Adjusted Value-to-Assets Ratio, which is near historical highs.
- At these levels, the market is pricing in expectations for Adjusted ROA levels to increase from last year’s 7% to 11%, accompanied by 2% annual growth in their Adjusted Assets.
- Considering management’s concerns about growth in their Chemical and Petroleum businesses, and their ability to meet sequential revenue growth targets, market expectations for an increasing Adjusted ROA appear too bullish.
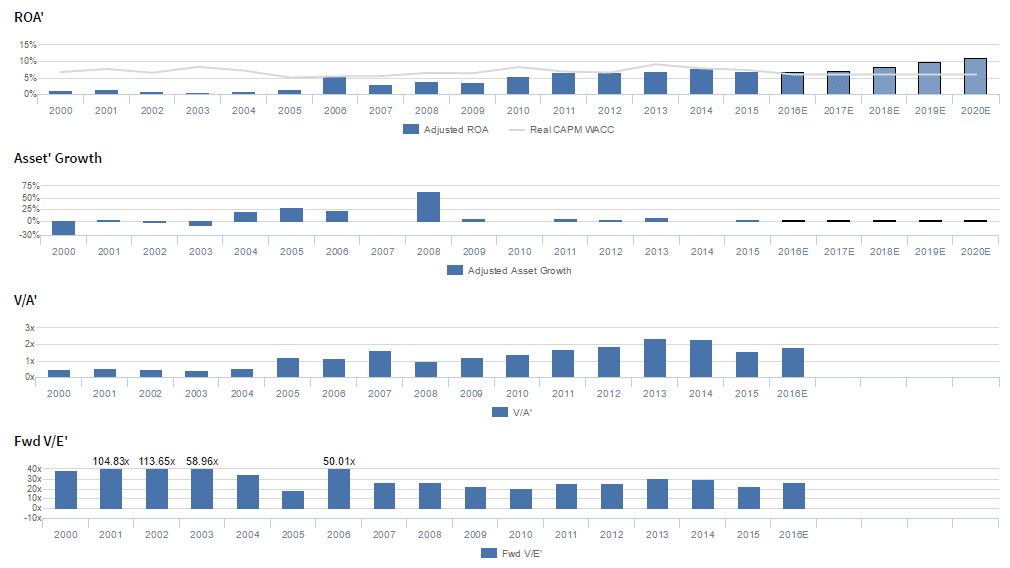
As a rail transportation business, KSU’s profitability is largely tied to the overall health of the economy, and as it operates in an asset-intensive business, the firm has historically seen Adjusted ROA levels at or below the cost of capital. Prior to 2006, KSU had struggled with weak Adjusted ROA performance, ranging from 0%-2% levels before jumping to 5% in 2006. Meanwhile, in the wake of the Great Recession, Adjusted ROA levels remained at around 3% before rebounding back to 5% in 2010, and have ranged from 6%-7% levels since. Meanwhile, Asset’ growth has been volatile, positive in 13 of the past 16 years, ranging from -29% to 62%.
Performance Drivers – Sales, Margins, and Turns
It can be helpful to break down ROA’ into its DuPont formula parts, Adjusted Earnings Margin (Earnings’ Margin) and Adjusted Asset Turnover (Asset’ Turns), which are the cleaned up margins and turns metrics used to calculate ROA’. The chart below details both Earnings’ Margin and Asset’ Turns historically, to help us better understand the drivers of the firm’s profitability and performance. The detail behind the chart can be found here.

Valuation Matrix – ROA’ and Asset’ Growth as Drivers of Valuation
When valuing a company, it is important to consider more than a singular target price, and instead the potential value of a firm at various levels of performance. The below matrix highlights potential prices for KSU at various levels of profitability (in terms of ROA’) and growth (Asset’ growth). Prices that are in excess of 10% equity upside are highlighted in black, and prices representing an excess of 10% equity downside are highlighted in red. To see more about the below chart, and also to be able to input your own scenarios to understand how it impacts valuations, please click here.

Click here to read the article in its entirety at Seeking Alpha.


