“Overall, declining Net/Gross PP&E levels signal continued subdued growth for the U.S., but pockets of opportunity remain”
“Net/Gross PP&E” levels are yet another indicator that U.S. firms are reluctant to invest. This forestalls any growth cycle and contributes to market multiples remaining at 20x to 22x Value-to-Earnings ratio and thereby a sideways to slightly upward S&P 1500
- The “net to gross” ratio of property, plant, and equipment (PP&E) levels have fallen to the lowest level measured in the S&P 1500 in 15 or more years. Firms are prioritizing asset efficiency over maintenance capex outlays and new investments.
- Overall, the only sector trending upward in terms of growth in reinvestment and capex spending is the Utilities sector, as firms have had to reinvest into renewable technology and natural gas assets.
- The Tech sector has shown a slight rebound in Net/Gross PP&E levels since dramatically falling following the burst of the internet bubble, but remain well below highs.
- Energy companies show a material decline in Net/Gross PP&E levels, as many have had to redirect cash flows toward servicing obligations. With the current oil and gas price environment, this is unlikely to change soon.
- Industrial firms have also seen declines in Net/Gross PP&E levels, as a focus on improving returns to shareholders has taken hold.
- Management teams continue to be wary of investing in growth, even in the low interest rate environment
Incremental interest rate hikes could actually spur more aggressive investments if management fears missing out on cheap financing for projects. - Until that happens, the U.S. stock market appears fairly valued with muted business growth holding back any significant rise in market-wide earnings multiples.
- For more on market valuations, see our Market Phase Cycle report for June 2016.

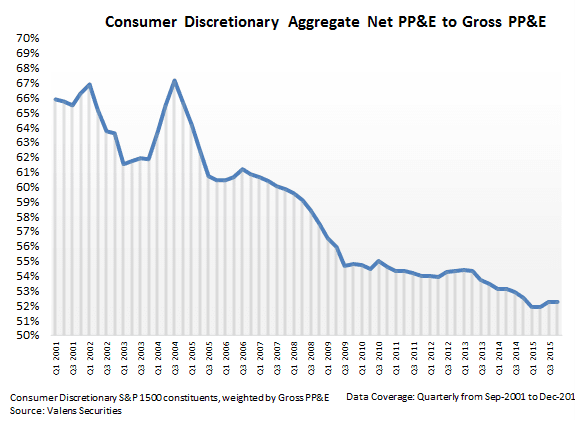
The ratio of Net PP&E to Gross PP&E (property, plant, and equipment) is a useful metric to use to understand when companies have been “milking” their balance sheets or ramping up investment in the face of expected growth opportunities. When Net/Gross PP&E ratios dramatically rise (as they did in 2005-2007), it means that management teams are aggressively investing in their assets to drive growth. When Net/Gross PP&E levels fall, management teams are instead deferring maintenance capex and managing for higher free cash flows in the near term.
Prior to recent declines, the aggregate Net/Gross PP&E of all S&P 1500 constituents bottomed out at 56.8% in 2010, with companies beginning to spend on necessary maintenance capex after multiple years of attempts to save in the wake of the Great Recession. Firms then appeared to have rebuilt Net/Gross PP&E levels to more normal levels until the middle of 2013, when companies again began to reduce maintenance capital spend, eventually leading Net/Gross PP&E levels to lows not seen since before 2001.
Net/Gross PP&E has experienced a series of declines in 2015. It is now at its lowest level this millennium, a further sign that management teams are not committed to investing in business growth, particularly in energy, healthcare, information technology and industrials markets.

Information Technology
The Information Technology sector has seen steady declines in the Net/Gross PP&E ratio since the bursting of the tech bubble in 2001. Companies began to reinvest in growth right before the Great Recession, but have mostly managed their cash flows while spending on capex only to maintain their asset base after the crash.
Additionally, tech firms have systematically underestimated the life of their assets, leading to lower Net/Gross PP&E levels than other sectors, as these firms are still carrying assets with zero value on their books. This is partly due to the fact that asset lives have been lengthening, as the effects of Moore’s Law have been diminishing. Firms’ investments are also becoming obsolete at a slower pace than they have historically. Nonetheless, Net/Gross PP&E levels have slowly increased since 2003-2004, and are near highs since then, as firms have begun to reinvest into their asset base to replace assets that are becoming obsolete.
Firms in the semiconductor and communications equipment industries have best exemplified this, with substantial declines in Net/Gross ratios between 2001 and 2004 following the internet bubble. Neither industry has seen Net/Gross PP&E levels improve back toward historical highs, as companies have been reluctant to reinvest material amounts of cash flows into their asset base. AMAT, INTC, and LLTC exemplify this best, and JNPR in particular has seen Net/Gross levels fall from +80% to recent lows below 50%, as they have invested less in maintaining their PP&E base, and more in building their working capital levels over the last several years instead.

Industrials
Industrial companies have been managing cash flows and deferring maintenance capex since 2001, with their gross to net PP&E ratios consistently compressing. Barring a period of reinvestment leading up to the Great Recession, industrial firms have been managing their cash flows to maximize their profitability. Furthermore, as the world moves away from a reliance on heavy industry, these firms have a reduced need to continually reinvest in new assets. Therefore, consistent with management’s fiduciary duty to shareholders, companies have been deferring spending on maintenance capex to enhance profitability in an attempt to boost share price. Moreover, with continued concerns about the health of the economy post-Great Recession, industrial firms have also been shying away from reinvestment, even in the current low interest rate environment.
Dover Corporation is a good example of an Industrials company that has been deferring reinvestment and capex to maintain their profitability. They have attempted to efficiently manage their cash flows and put off growth to continue paying their robust dividend. This has been difficult as the firm faced headwinds to profitability after the tech bubble burst due to their tech exposure, and again recently due to energy price headwinds. However, due to rising energy prices prior to the housing market crisis in 2008, and once again in 2013, they began to reinvest in their energy business. Unfortunately, the resulting compression in oil prices and their fluid business’s exposure to China has relegated the firm to prioritize their dividend over their aging asset base.

Energy
Energy companies saw Net/Gross PP&E levels increase consistently going into 2008, as improving prices led to increased investment in firms’ asset bases, and a number of new companies coming into the market to take advantage of bloated valuations. However, since 2009, ratios have come down again, and Net/Gross PP&E levels have substantially fallen since 2015. This has also been driven by prices, as firms have had to reduce or completely stop investment into their asset base to keep up with oil prices that have fallen from +70% highs. Continued suppression in price implies that even if firms should be reinvesting soon, it may not be economically possible for them to do so, leading to a continuation of this trend.
This trend in Net/Gross PP&E levels has also been driven by some of the firms’ credit concerns driving their inability to invest materially in their asset base. Chesapeake is a good example, with their current credit issues well known to the public and to investors. As such, they have focused on cutting costs and focusing on sustaining cash flows to service their obligations, not including maintenance capex. This has led to material declines in their Net/Gross PP&E ratio, from +60% in as recent as Q1 2014, to current 43% levels.

Utilities
Utilities firms have actually seen substantial Net/Gross PP&E increase over the past 15 years, in contrast to other sectors and the market overall. This growth has been driven by material investment in electric and multi-utility firms who have been investing in building out their renewable energy footprint. Furthermore, the U.S. has seen large increases in proven reserves of natural gas since 2000 due to the development of shale gas extraction techniques such as fracking. As such, previously uneconomical shale gas is now accessible in large quantities. Natural gas has since become the top source of electric power in the U.S., partly due to sustained low natural gas prices. Natural gas also burns much cleaner than coal, with less greenhouse gas emissions, suggesting that natural gas can serve as a bridge to renewable energy going forward. As a result, companies have been actively reinvesting in new assets which use natural gas as fuel rather than coal.
Firms such as Pacific Gas and Electric (PCG), which operates in California, have been under regulatory pressure to meet renewable energy targets, causing them to substantially invest into their asset base. Moreover, with 29 states actively adopting renewable portfolio standards mandating that utility companies sell a specified percentage or amount of renewable energy, firms across the U.S. have been investing in renewable assets to meet these new requirements.
Conclusion
Net/Gross PP&E levels are at long-term lows, indicating that management teams continue to be wary of investing to grow their asset bases, even in the low interest rate environment. However, at current levels, it is simply a matter of time before firms begin to invest in growth, increasing demand for credit.
Furthermore, incremental interest rate hikes could actually spur aggressive investment, as management fears about missing out on the current rate environment could force their hands, opening the door to the second stage of this bull market where higher earnings multiples and market valuations will be seen.
Please see Valens Research’s most recent Market Phase Cycle for more on the market’s aggregate performance and valuation levels.
Until next time,
Joel
Appendix