
1.9 billion drinks sold a day may not be enough to quench high market expectations and justify a lofty 31x Uniform P/E

This marketing giant managed to rebrand its cure-all tonic into a refreshment enjoyed by billions of people worldwide. They’ve become such a household name that in the Philippines, no celebration of any type would be complete without it.
Plus, their products are everywhere. From your humble sari-sari store to the fanciest of restaurants, their expansion strategy of “never being out of reach” really stands clear.
Though as-reported ROA seems to signal that this strategy is doing poorly, TRUE UAFRS-based (Uniform) analysis shows that this company has actually been able to produce consistently robust profitability.
Also below, Uniform Accounting Embedded Expectations Analysis and the Uniform Accounting Performance and Valuation Tearsheet for the company
Philippine Markets Daily:
Thursday Uniform Earnings Tearsheets – Global Focus
Powered by Valens Research
Some accidents are happy accidents. Some are just plain accidents. For Colonel John Pemberton, it’s both.
As the American Civil War was nearing its end, Pemberton sustained a stab wound in the battlefield that had doctors administering a lot of morphine into his system. This treatment continued as he began to recover.
But he became addicted to the drug and was actively looking for a way out. He was looking for an alternative.
He then created a mixture of coca wine, kola nut, and damiana (an anti-anxiety shrub) and called it “Pemberton’s French Wine Coca Nerve Tonic.” It was eventually marketed as a “nerve tonic” and sold to the public through pharmacies.
When prohibition was passed and his nerve tonic was essentially banned, Pemberton whipped up a non-alcoholic version then sold it at drugstore soda fountains.
What was supposed to be another tonic for some other illness became the most recognizable drink we know today: Coca-Cola.
But the soda’s massive success was never fulfilled under Pemberton. It was with another entrepreneur, Asa Candler.
When Asa Candler bought out the company shortly after Pemberton’s death, it was his strategy that launched the soda to national popularity.
First, he handed out coupons for a free glass of coke. It was believed that people would be happy to try anything for free but then would be willing to pay for it as a customer later.
He was right. This strategy worked phenomenally. By the early 1900’s, about one in nine Americans drank coke. By then, the drink had already spread across the U.S.
Second was the decision to take it out of soda fountains and have it bottled for distribution instead. When that took off, Coca-Cola rebranded itself to be a refreshing beverage rather than a cure-all.
The rest is a series of marketing strategies that allowed the company to sell more at higher prices.
Needless to say that Coca-Cola’s advertisements are iconic.
From its incredibly viral “Share a Coke” campaign to its World Cup features to the local “Coke ko ’to!” beat craze that swept the Philippines, Coca-Cola’s vast array of advertising campaigns helped it remain a household name.
What’s more impressive is that they’re not even selling taste, they’re selling moments.
You know it’s working well, too. In the Philippines alone, they’ve managed to embed Coca-Cola into our culture: no celebration would be complete without bottles of coke.
Like its advertisements, Coca-Cola products are everywhere.
With over 3,900 products ranging from sodas to water, juices, coffees, and teas, it’s not surprising that Coca-Cola has such an expansive reach.
They’re available in your neighbourhood sari-sari store to supermarkets, to a majority of restaurants, and basically everywhere else globally (except for Cuba and North Korea).
Although Coca-Cola has remained a powerful global brand and has yielded phenomenal return on assets, investors using as-reported metrics may be misled to believe that its strategy has faltered in recent years.
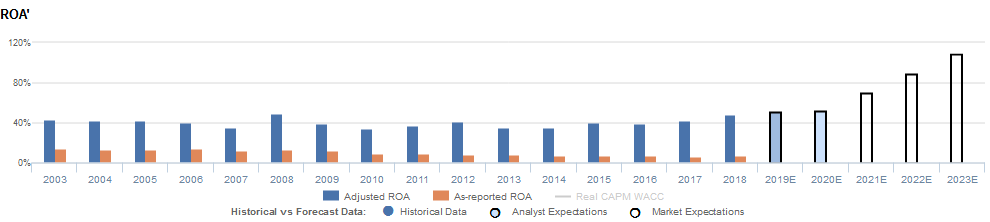
Return on assets (ROA) have declined from peak 13%-14% levels in 2003-2006 to near corporate average levels of 7% in 2015-2018.
However, Uniform Accounting indicates that as-reported metrics are understating Coca-Cola’s profitability and shows how the strength of its brands and global reach has enabled it to have robust returns, with a Uniform ROA above 34% in each year since 2003.

Investors appear to recognize Coca-Cola’s strength and that as-reported metrics are artificially distorting the company’s performance, as the firm currently trades at a premium Uniform P/E of 31x.
At the current stock price, the market expects Coca-Cola to see Uniform ROA rise from 48% in 2018 to an all-time high of 73% in 2023, accompanied by steady 4% Uniform asset growth.
Considering the company’s strong performance, expecting returns to persist might make sense. But expecting a consumer staples company with remarkably stable returns to see profitability take off like a rocket ship appears unreasonable.
On top of this, management appears to be concerned about manufacturing capex, developing market and organic revenue growth, and their zero-sugar products. With expectations so high, management cannot have any missteps.
It may be difficult for the firm to meet exceptionally high market expectations and justify lofty valuations going forward, even with its strong brand strategy.
Coca-Cola’s earning power is actually more robust than what as-reported metrics would have you believe

As-reported metrics significantly understate Coca-Cola’s (KO) profitability. For example, as-reported ROA for KO was 7% in 2018, almost 7x lower than Uniform ROA of 48%, making KO appear to be a much weaker business than real economic metrics highlight.
Moreover, since 2006, as-reported ROA has halved, fading from 14% to current 7% levels, while Uniform ROA has expanded from 40% to 48% over the same period, directionally distorting the market’s perception of the firm’s historical profitability trends.
Historically, KO has seen relatively stable, robust profitability. From 2003-2007, Uniform ROA ranged between 35%-43%, before peaking at 49% in 2008, and subsequently stabilizing at 34%-41% levels through 2016. Since then, Uniform ROA has expanded to current 48% levels in 2018.
Coca-Cola’s Uniform ROA is driven by significantly more robust Uniform asset turns but is offset by Uniform earnings margins
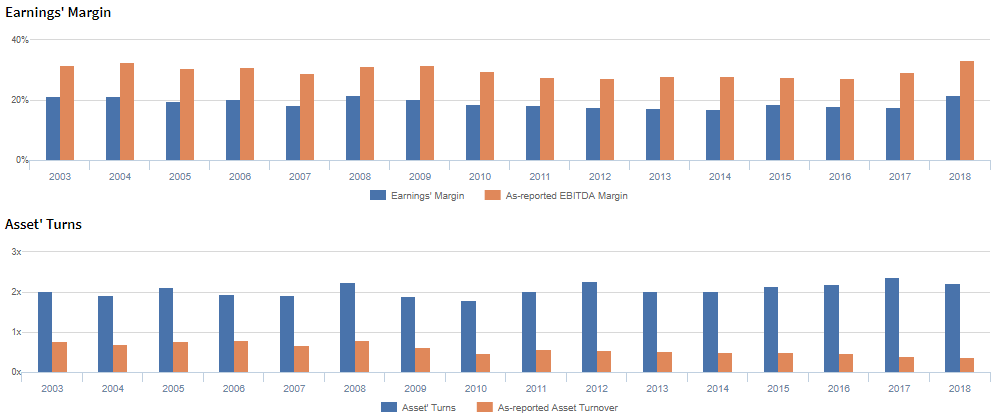
Stability in Uniform ROA has been driven by offsetting trends in Uniform earnings margins and Uniform asset turns.
Uniform margins declined from 22% in 2004 to 18% in 2007, before rebounding to 22% in 2008. Then, Uniform margins gradually declined to 17%-19% in 2010-2017, but have since expanded to 22% in 2018.
Meanwhile, Uniform turns ranged between 1.9x-2.1x from 2003-2007, before improving to 2.3x in 2008. Then, despite falling to a low of 1.8x in 2010, Uniform turns expanded to a peak of 2.4x in 2017, before fading to 2.2x in 2018.
At current valuations, markets are pricing in expectations for both Uniform margins and Uniform turns to expand to new record highs.
SUMMARY and Coca-Cola Tearsheet
As the Uniform Accounting tearsheet for the Coca-Cola Company (KO) highlights, the Uniform P/E trades at 30.7x, well above corporate average valuation levels and its own recent history.
High P/E’s require high EPS growth to sustain them. In the case of Coca-Cola, the company has recently shown an 11% Uniform EPS growth.
Wall Street analysts provide stock and valuation recommendations that in general provide very poor guidance or insight. However, Wall Street analysts’ near-term earnings forecasts tend to have relevant information.
We take Wall Street forecasts for GAAP earnings and convert them to Uniform earnings forecasts. When we do this, Coca-Cola’s Wall Street analyst-driven forecast is 13% into 2019. That rebounds with only 8% growth in earnings from 2019 to 2020.
Based on current stock market valuations, we can use earnings growth valuation metrics to back into the required growth rate to justify Coca-Cola’s $54 stock price. These are often referred to as market embedded expectations.
In order to justify current stock prices, the company would need to have Uniform earnings grow by a moderate 9% each year over the next three years.
Wall Street analyst earnings growth expectations are somewhat volatile over the next two years, but ultimately, they generally fall in-line with the earnings growth rates required to justify current valuations.
With its high valuations, Coca-Cola’s Uniform P/E is among the highest in its peer group, while its Uniform EPS growth is also well above peer averages.
Meanwhile, the company’s earning power is 8x corporate averages, and as a result of its strong cash flows and sizable cash buffer, both credit risk and dividend risk remain low.
To summarize, Coca-Cola is a company with high earning power, with equally high embedded expectations, and it must sustain its historical earnings growth to justify current valuations.
About the Philippine Markets Daily
“Thursday Uniform Earnings Tearsheets – Global Focus”
Some of the world’s greatest investors learned from the Father of Value Investing or have learned to follow his investment philosophy very closely. That pioneer of value investing is Professor Benjamin Graham. His followers:
Warren Buffett and Charles Munger of Berkshire Hathaway; Shelby C. Davis of Davis Funds; Marty Whitman of Third Avenue Value Fund; Jean-Marie Eveillard of First Eagle; Mitch Julis of Canyon Capital; just to name a few.
Each of these great investors studied security analysis and valuation, applying this methodology to manage their multi-billion dollar portfolios. They did this without relying on as-reported numbers.
Uniform Adjusted Financial Reporting Standards (UAFRS or Uniform Accounting) is an answer to the many inconsistencies present in GAAP and IFRS, as well as in PFRS.
Under UAFRS, each company’s financial statements are rebuilt under a consistent set of rules, resulting in an apples-to-apples comparison. Resulting UAFRS-based earnings, assets, debts, cash flows from operations, investing, and financing, and other key elements become the basis for more reliable financial statement analysis.
Every Thursday, we focus on one multinational company that’s particularly interesting from a UAFRS vs as-reported standpoint. We highlight one adjustment that illustrates why the as-reported numbers are unreliable.
This way, we gain a better understanding of the factors driving a particular stock’s returns, and whether or not the firm’s true profitability is reflected in its current valuations.
Hope you’ve found this week’s Uniform earnings tearsheet on a multinational company interesting and insightful.
Stay tuned for next week’s multinational company highlight!
Regards,
Angelica Lim & Joel Litman
Research Director & Chief Investment Strategist
Philippine Markets Daily
Powered by Valens Research
www.valens-research.com