
Offering luxurious living in premium locations helped this company reach Uniform ROAs of 6%+, not below cost of capital per as-reported ROAs

The Philippines’ central business districts (CBD) have been occupied by some of the biggest companies in the country.
This luxury real estate company was able to benefit from this by constructing premium and classy buildings in these locations. However, looking at its as-reported metrics, it seems that focusing on this strategy hasn’t been enough to achieve cost-of-capital returns.
Also below, Uniform Accounting Embedded Expectations Analysis and the Uniform Accounting Performance and Valuation Tearsheet for the company.
Philippine Markets Daily:
Tuesday Uniform Earnings Tearsheets – Philippine-listed Focus
Powered by Valens Research
For years, the Philippines has been known to be an expanding haven for commerce in Asia. Statistically, the number of registered businesses in the country have actually reached 1.42 million in 2019, an increase of 30,000 from the previous year’s 1.32 million.
This has caused urban and township developments to massively populate the central business districts (CBD) of the most bustling cities in the country—namely Makati, Ortigas, Cebu, and Bonifacio Global City (BGC).
One of the companies that capitalizes on these locations is Shang Properties, Inc. (SHNG:PHL).
Established in 1987, the company was initially focused on growing its business through property leasing.
In 2002, Shang Properties decided to expand its portfolio by entering the residential condominium market, building high-rise condominium projects in premium locations, including the Shang Grand Tower in Makati, the St. Francis Shangri-La Place in Ortigas, and One Shangri-La Place in Mandaluyong.
In 2007, Edsa Properties Philippines, Inc. (EPHI) and Kuok Philippine Properties, Inc. (KPPI) consolidated its business into the company, which greatly improved Shang Properties’ profitability and core business in the process.
The transaction also allowed the company to have a significant land bank of over 500 hectares in different locations to use for its projects.
One of its recent projects—the Shang Salcedo Place—was built in the very heart of the Makati CBD in 2017, providing its tenants with hotel-like features and a convenient way of accessing offices, malls, transportation, and the main streets of the city.
A year after that, the company unveiled yet another project in another prime position in Mandaluyong City, Shang Residences at Wack Wack.
Its location gave Shang Properties an advantage to gain more occupants since it can easily reach key cities such as San Juan, Pasig, Mandaluyong, and Makati, and because it’s also surrounded by state-of-the-art medical facilities, highly reputable schools, and huge entertainment centers.
Besides focusing on the residential market, Shang Properties also delved into retail and office leasing to build up its portfolio. The company owns and operates the Shangri-la Shopping Center, one of the luxurious lifestyle destinations in the country located in Mandaluyong City.
On top of that, Shang Properties currently has an 86% share in KSA Realty Corporation, which is the company that owns the Enterprise Center in Makati. The Enterprise Center is a highly distinguished office building in the heart of the city’s financial district.
To further expand its business, Shang Properties partnered with Robinsons Land Corporation (RLC) and formed Shang Robinsons Properties, Inc. (SRPI). As a result of this venture, the company was able to launch another high-rise condominium project at BGC in 2019: the Aurelia Residences.
Given Shang Properties’ focus on offering elegant living through urban developments in premium locations, it would be reasonable to expect robust, increasing returns for the company.
However, this strategic approach, as well as its mission to form more partnerships, have not generated robust profitability, with as-reported ROAs only reaching below cost-of-capital levels.
In reality, focusing on its premium luxury strategy has actually helped Shang Properties achieve above cost-of-capital returns, with Uniform ROAs reaching 6%+.
One of the distortions between Uniform and as-reported ROAs comes from as-reported metrics failing to consider how current liabilities are factored into the ROA calculation. Traditional ROA calculations for measuring a firm’s earning power only include current and long-term assets as part of the cost of investment.
However, a company’s ability to receive goods and services in advance of payments—the current operating liabilities—ought to be factored in as well.
Current liabilities (excluding short-term debt) are necessary for operations. Items such as accounts payable, accrued expenses, and others are used to maintain the firm’s current capital position. On the other hand, long-term liabilities are mostly just used to finance the business.
If a company has a ton of cash to service its current liabilities and we only factor in its cash and not its current liabilities, it would make the company look inefficient. In reality, the company is just being responsible by building liquid assets to meet short-term obligations.
As such, net working capital (current assets less current liabilities) is used for the firm’s ROA calculation. This shows a company’s real cash management ability and thereby, its true earning power.
In the case of Shang Properties, as-reported metrics’ asset base for ROA calculation is at PHP 63.4 billion in 2019, leading to a 4% as-reported ROA. However, when subtracting current operating liabilities and applying other necessary adjustments, we arrive at the company’s PHP 51.8 billion Uniform assets, resulting in a 6% Uniform ROA.
Shang Properties’ earning power is stronger than you think
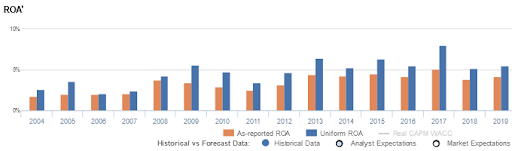
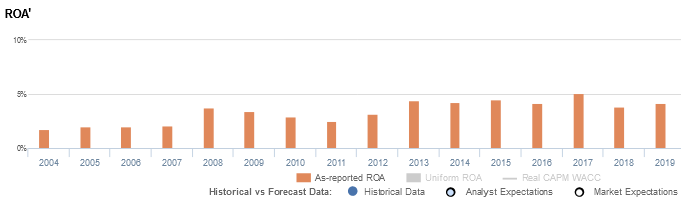
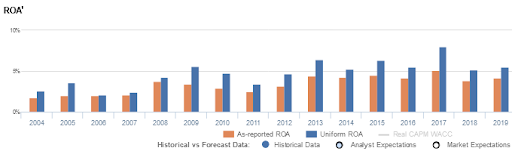
As-reported metrics distort the market’s perception of the firm’s historical profitability. If you were to just look at as-reported ROA, you would think Shang Properties’ profitability has been weaker than real economic metrics have highlighted in the past sixteen years.
In reality, Shang Properties’ true profitability has generally been higher than as-reported ROA since 2004. Specifically, Uniform ROA was 6% in 2019, but as-reported ROA was only 4% that year. Though this difference may seem small, it’s actually the difference between a profitable company and a company barely earning enough to cover its cost of capital.
Since 2004, as-reported ROA has ranged from 3%-5% levels through 2019, and is currently sitting at the middle part of that range.
Meanwhile, after expanding from 3% in 2004 to 4% in 2005, Uniform ROA declined to 2% in 2006, before improving to 6% in 2009. Thereafter, Uniform ROA fell back to 3% in 2011, before subsequently rising to a peak of 8% in 2017 and compressing back to 6% in 2019.
Shang Properties’ earnings margin is weaker than you think, but its Uniform asset turns make up for it
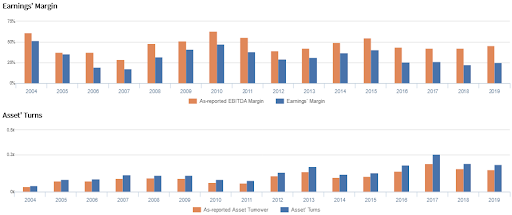
Shang Properties’ profitability has been driven by offsetting trends in Uniform earnings margin and Uniform asset turns.
Uniform margins declined from 52% in 2004 to 18% in 2007, before steadily expanding to 48% in 2010 and compressing to 29% in 2012. Thereafter, Uniform margins improved to 41% in 2015, before receding to 23%-26% levels through 2019.
Meanwhile, Uniform turns ranged from 0.1x to 0.2x through 2016, before expanding to 0.3x in 2017 and falling back to 0.2x levels in 2019-2020.
At current valuations, the market is pricing in an expectation for both Uniform margins and Uniform turns to decline.
SUMMARY and Shang Properties, Inc. Tearsheet
As the Uniform Accounting tearsheet for Shang Properties, Inc. (SHNG:PHL) highlights, it trades at a Uniform P/E of 6.8x, below the global corporate average of 23.7x, but around its historical average of 8.5x.
Low P/Es require low EPS growth to sustain them. In the case of Shang Properties, the company has recently shown a 37% Uniform EPS growth.
Sell-side analysts provide stock and valuation recommendations that provide very poor guidance or insight in general. However, sell-side analysts’ near-term earnings forecasts tend to have relevant information.
We take sell-side forecasts for Philippine Financial Reporting Standards (PFRS) earnings and convert them to Uniform earnings forecasts. When we do this, Shang Properties’ sell-side analyst-driven forecast calls for a 18% and 1% Uniform EPS growth in 2020 and 2021, respectively.
Based on current stock market valuations, we can use earnings growth valuation metrics to back into the required growth rate to justify Shang Properties’ PHP 2.69 stock price. These are often referred to as market embedded expectations.
Shang Properties is currently being valued as if Uniform earnings were to shrink 17% annually over the next three years. What sell-side analysts expect for Shang Properties’ earnings growth is above what the current stock market valuation requires in 2020 and 2021.
Furthermore, the company’s earning power is below the long-run corporate average, and cash flows and cash on hand are also below total obligations—including debt maturities, capex maintenance, and dividends. Together, this signals a moderate dividend risk.
To conclude, Shang Properties’ Uniform earnings growth is below its peer averages, but the company is trading in line with its peer average valuations.
About the Philippine Market Daily
“Tuesday Uniform Earnings Tearsheets – Philippine-listed Focus”
Some of the world’s greatest investors learned from the Father of Value Investing or have learned to follow his investment philosophy very closely. That pioneer of value investing is Professor Benjamin Graham. His followers:
Warren Buffett and Charles Munger of Berkshire Hathaway; Shelby C. Davis of Davis Funds; Marty Whitman of Third Avenue Value Fund; Jean-Marie Eveillard of First Eagle; Mitch Julis of Canyon Capital; just to name a few.
Each of these great investors studied security analysis and valuation, applying this methodology to manage their multi-billion dollar portfolios. They did this without relying on as-reported numbers.
Uniform Adjusted Financial Reporting Standards (UAFRS or Uniform Accounting) is an answer to the many inconsistencies present in GAAP and IFRS, as well as in PFRS.
Under UAFRS, each company’s financial statements are rebuilt under a consistent set of rules, resulting in an apples-to-apples comparison. Resulting UAFRS-based earnings, assets, debts, cash flows from operations, investing, and financing, and other key elements become the basis for more reliable financial statement analysis.
Every Tuesday, we focus on one Philippine-listed company that’s particularly interesting from a UAFRS vs as-reported standpoint. We highlight one adjustment that illustrates why the as-reported numbers are unreliable.
This way, we gain a better understanding of the factors driving a particular stock’s returns, and whether or not the firm’s true profitability is reflected in its current valuations.
Hope you’ve found this week’s Uniform Earnings Tearsheet on a Philippine company interesting and insightful.
Stay tuned for next week’s Philippine company highlight!
Regards,
Angelica Lim
Research Director
Philippine Markets Daily
Powered by Valens Research
www.valens-research.com