
Profitability for this airline company has been distorted by massive non-cash charges, TRUE returns are actually 2x higher than as-reported

Airlines have operated at a significantly reduced capacity for the majority of Q2 2020, and it seems like the perfect opportunity for a “Big Bath” scenario to occur in the following quarters.
A “Big Bath” scenario is when companies take large write-offs and unusual charges in down years because investors are expecting a fall in earnings anyway. That way, these charges get to be expensed now while future profitability appears better in comparison.
This airline company did this back in 2008 and could be due for another “Big Bath” in Q2 2020. Consequently, these charges have significantly distorted the company’s profitability, with as-reported metrics being considerably lower than TRUE UAFRS-based (Uniform) return on assets (ROA).
Also below, Uniform Accounting Embedded Expectations Analysis and the Uniform Accounting Performance and Valuation Tearsheet for the company.
Philippine Markets Daily:
Thursday Uniform Earnings Tearsheets – Global Focus
Powered by Valens Research
Over a decade ago, the global economy experienced one of the worst financial crises since the Great Depression. Excessive risk taking by banks and a collapse in the subprime lending market led to the contagion that sent the world into economic shock.
Given its cyclicality, the airline industry generated major losses during this difficult period. The industry had seen an unprecedented drop in passenger traffic, mounting debt, and the threat of rising fuel costs post-crisis that slowed down recovery even further.
Today, the airline industry is facing the same fate.
When news broke that the coronavirus outbreak had become a pandemic in March, demand for air travel took a dive as restrictions were immediately implemented.
US airline revenues, specifically, collapsed as cancellations surpassed bookings. This is expected to persist while airlines continue to operate at a reduced fleet capacity and people are discouraged from flying.
Smaller, mostly regional airlines such as Trans States Airlines and Compass Airlines had already filed for bankruptcy citing coronavirus headwinds. Adding more to the industry-wide bankruptcy concerns, David Calhoun, CEO of Boeing, said that a major airline would likely go down for that same reason.
To prevent that from happening, the US government approved a bailout fund for the airline industry totaling $58 billion in aid for payroll and company operations.
Delta Air Lines, Inc. (DAL) got the third-largest piece of this pie, totaling about $5.4 billion. The company then took to the markets and raised $5 billion to further fortify its balance sheet and replace lost cash flows.
Meanwhile, the company reported a loss of $530 million for Q1 2020, a steep decline coming from last year’s Q1 income of $730 million.
With a constant barrage of news surrounding threats of bankruptcy, piling debt, and loss of operations and revenues, it’s no surprise that the stock has plummeted about 50% since mid-February.
Unfortunately, it won’t stop there—the rest of the year might be worse as a “Big Bath” scenario is likely to occur.
As discussed by Valens Research President and CEO Joel Litman in his latest Forbes article, a “Big Bath” scenario occurs when a collapse in actual cash earnings is compounded by a financial reporting anomaly.
Simply put, CFOs take the opportunity to legally expense write-offs and write-downs—among other unusual charges—that would otherwise be accounted for in future periods. Analysts and investors are already expecting a bad earnings season, so this would be the perfect opportunity to unload these charges.
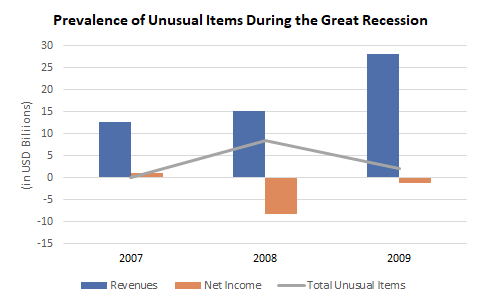
To illustrate, after emerging from bankruptcy in 2007, Delta was landing in an economy facing imminent collapse. In 2008, at the peak of the economic recession, the company had recorded a $7.3 billion impairment on goodwill and other intangible assets plus restructuring charges totaling $1.1 billion.
Fast forward to 2020, a repeat of a “Big Bath” for Delta is likely in Q2, given that lockdowns were implemented during two-thirds of that period, and to a lesser degree, in Q3 and Q4 depending on the speed of the economy’s recovery.
Delta has yet to record any special charges on its Q1 report, but given the massive impact of the shutdowns in its operations, an annual re-evaluation of goodwill and other intangible assets, or a restructuring might be underway.
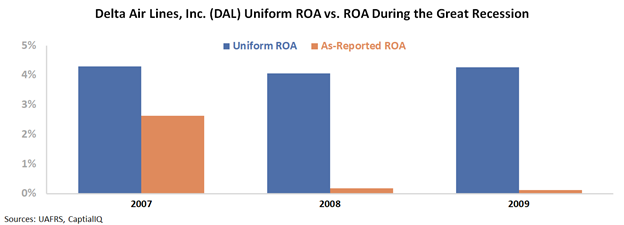
While investors may be concerned about Delta’s profitability, Uniform Accounting tells us that it’s not as bad as it looks.
As-reported metrics made it appear that the company had a near-zero ROA in 2008, but Uniform Accounting revealed a much less grim picture. Removing the non-cash expenses (such as goodwill impairment) shows the company’s true ROA of 4%.
Furthermore, since Delta’s emergence from bankruptcy in 2007 and its merger with Northwest in 2008, goodwill has been consistently present on the balance sheet.
For the past twelve years, this made it seem as if Delta had lower profitability than it actually has. In reality, Uniform metrics show profitability that is a lot stronger than what as-reported data states.

The distortion comes from as-reported metrics failing to consider the amount of goodwill on Delta’s balance sheet, which sits at about $9.7 billion in recent years.
Goodwill is an intangible asset that is purely accounting-based and unrepresentative of the company’s actual operating performance. When as-reported accounting includes this in a company’s balance sheet, it creates an artificially inflated asset base.
As a result, as-reported ROAs are not capturing the strength of Delta’s earning power. Adjusting for goodwill, returns are actually 2x-4x greater.
So while the pandemic seems to be pointing to Delta’s next “Big Bath” in Q2, though we haven’t seen anything yet, it’s best to prepare for a stock sell-off once earnings come worse than expected due to write-offs and unusual charges.
However, this should not take away from the fact that, looking at the bigger picture, Delta remains an above-cost-of-capital returns firm contrary to what as-reported metrics would have investors believe.
Delta’s earning power is actually more robust than you think
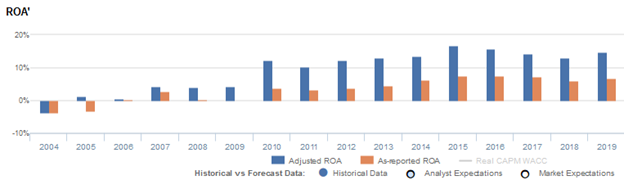
As-reported metrics distort the market’s perception of the firm’s recent profitability. If you were to just look at as-reported ROA, you would think that the company is a much weaker business than real economic metrics highlight.
Delta’s Uniform ROA has actually been higher than its as-reported ROA in the past sixteen years. For example, as-reported ROA was 7% in 2019, but its Uniform ROA was actually 2x higher at 15%.
Through Uniform Accounting, we can see that the company’s true ROAs have actually been much higher. Delta’s Uniform ROA has ranged from -4% to 17% in the past sixteen years while as-reported ROA ranged only from -4% to 8% in the same timeframe.
After inflecting from negative levels in 2004 to 4% in 2007, Uniform ROA further improved to 12% in 2010. It then gradually expanded to a peak of 17% in 2015, before contracting to 15% in 2019.
Delta’s Uniform earnings margins are weaker than you think, but its robust Uniform asset turns make up for it

Delta’s profitability has been driven by trends in Uniform earnings margins and, to a lesser extent, Uniform asset turns.
From 2004-2009, Uniform earnings margins inflected positively from -7% to 5%, before jumping to 11% in 2010 and subsequently regressing to 8% in 2011. Then, after rebounding to 12% in 2016, Uniform margins faded to 10% in 2018, before recovering to 12% in 2019.
Meanwhile, Uniform turns steadily improved from 0.5x in 2004 to 1.5x peaks in 2014-2015, before compressing to 1.2x in 2019.
At current valuations, markets are pricing in expectation for Uniform margins and Uniform turns to decline.
SUMMARY and Delta Air Lines Tearsheet
As the Uniform Accounting tearsheet for Delta Air Lines, Inc. (DAL) highlights, the Uniform P/E trades at -21.3x, which is below corporate average valuation levels and its own recent history.
Negative P/Es require low EPS growth to sustain them. In the case of Delta, the company has recently shown a 39% Uniform EPS growth.
Wall Street analysts provide stock and valuation recommendations that in general provide very poor guidance or insight. However, Wall Street analysts’ near-term earnings forecasts tend to have relevant information.
We take Wall Street forecasts for GAAP earnings and convert them to Uniform earnings forecasts. When we do this, Delta’s Wall Street analyst-driven forecast is a 181% and 171% shrinkage in 2020 and 2021.
Based on current stock market valuations, we can use earnings growth valuation metrics to back into the required growth rate to justify Delta’s $30 stock price. These are often referred to as market embedded expectations.
The company needs to have Uniform earnings shrink by 15% or less each year over the next three years to justify current prices. What Wall Street analysts expect for Delta’s earnings growth is far below what the current stock market valuation requires.
Furthermore, the company’s earning power is 2x the corporate average. However, cash flows are below total obligations—including debt maturities, capex maintenance, and dividends. Together, this signals somewhat moderate credit and dividend risk.
To conclude, Delta’s Uniform earnings growth is in line with its peer averages in 2020. The company is also trading below average peer valuations.
About the Philippine Market Daily
“Thursday Uniform Earnings Tearsheets – Global Focus”
Some of the world’s greatest investors learned from the Father of Value Investing or have learned to follow his investment philosophy very closely. That pioneer of value investing is Professor Benjamin Graham. His followers:
Warren Buffett and Charles Munger of Berkshire Hathaway; Shelby C. Davis of Davis Funds; Marty Whitman of Third Avenue Value Fund; Jean-Marie Eveillard of First Eagle; Mitch Julis of Canyon Capital; just to name a few.
Each of these great investors studied security analysis and valuation, applying this methodology to manage their multi-billion dollar portfolios. They did this without relying on as-reported numbers.
Uniform Adjusted Financial Reporting Standards (UAFRS or Uniform Accounting) is an answer to the many inconsistencies present in GAAP and IFRS, as well as in PFRS.
Under UAFRS, each company’s financial statements are rebuilt under a consistent set of rules, resulting in an apples-to-apples comparison. Resulting UAFRS-based earnings, assets, debts, cash flows from operations, investing, and financing, and other key elements become the basis for more reliable financial statement analysis.
Every Thursday, we focus on one multinational company that’s particularly interesting from a UAFRS vs as-reported standpoint. We highlight one adjustment that illustrates why the as-reported numbers are unreliable.
This way, we gain a better understanding of the factors driving a particular stock’s returns, and whether or not the firm’s true profitability is reflected in its current valuations.
Hope you’ve found this week’s Uniform earnings tearsheet on a multinational company interesting and insightful.
Stay tuned for next week’s multinational company highlight!
Regards,
Angelica Lim
Research Director
Philippine Markets Daily
Powered by Valens Research
www.valens-research.com