
This company is smart enough to manufacture phones for tech players. Their earning power is actually 6x what is reported!

The Philippine smartphone market surged 4% year-on-year in 2018 as more Chinese brands ramped up their marketing efforts.
Using aggressive marketing, Chinese brand OPPO has been performing well in the industry, taking in a 16.5% market share in the country’s mobile vendor market for January 2020, according to Global Stats. They now rank second next to Samsung, who has a 28% market share.
Apple and Huawei came in third and fourth with market shares of 15.9% and 13.7%, respectively. However, there’s this Taiwanese company you’ve probably never heard of that is benefitting from these two brands in the Philippines.
Also below, Uniform Accounting Embedded Expectations Analysis and the Uniform Accounting Performance and Valuation Tearsheet for the company.
Philippine Markets Daily:
Wednesday Tearsheet & Embedded Expectations
Powered by Valens Research
Terry Gou founded Hon Hai Precision Industry Co., Ltd., better known as Foxconn Technology Co., Ltd. (2354:TAI), in 1974 with just $7,500. He believed that a time would come when electronic products would be an essential part of everyday life.
With only ten elderly workers at the beginning, the company started making plastic parts for television sets.
By 1980, a big opportunity came for this company in a rented shed when they received an order from Atari to make their console joystick.
It was also around the same decade that Gou made an effort to search for more customers in the US, breaking in uninvited into many companies despite being hindered by security multiple times.
Being the aggressive salesman that he is, Gou was able to get many additional orders for the company.
In 1988, Gou opened Foxconn’s first manufacturing plant in mainland China in Longua Town, Shenzhen. The company’s largest factory is still located in this place today.
Close to a decade later, in 1996, the company had another breakthrough moment. They started building desktop chassis for Compaq.
This paved the way for Foxconn to build the chassis for other high-profile companies like HP, IBM, and Apple.
A few years and a lot more hard work later, Foxconn became the world’s largest electronics contract maker. The company now catered to a lot of global companies specifically in America, Canada, China, Finland, and Japan.
Foxconn is mostly known for manufacturing iPhones and other Apple products. But its long list of customers includes other big names like Blackberry, Google, Cisco, Amazon, HP, Dell, and other US electronics companies.
They also service the Asian brands Xiaomi and Huawei, which are both doing quite well in the global smartphone scene.
Their other Asian clients include Acer, Motorola, Sony, Nintendo, and Toshiba.
A company this large will require massive manpower to successfully operate. Foxconn is actually the largest private employer in Taiwan, and one of the largest in the world.
The company is focused on building their brand and acquiring technology of their own. In 2016, they bought a majority stake in Sharp Corp. for $3.5bn.
Foxconn also acquired Belkin and its associated brands Wemo and Linksys in 2018. Belkin is known for phone and PC accessories; Linksys makes networking equipment; and Wemo manufactures home automation equipment.
The company is currently constructing its Smart Manufacturing Center in Wisconsin, which is expected to create jobs in the United States. However, this project is covered with a lot of controversies, which might be why the market is bearish on the stock.
Foxconn is cheaper than you think
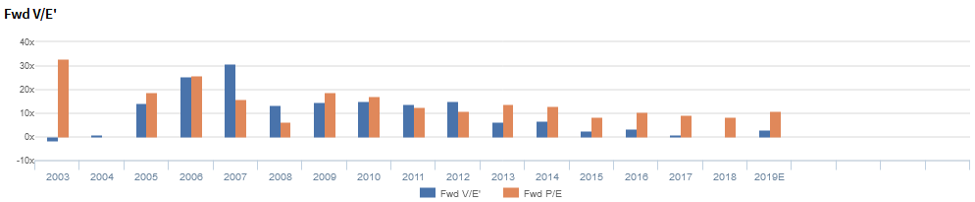
Foxconn Technology Co., Ltd. (2354:TAI) currently trades around recent averages with a 2.8x Uniform P/E (blue bars).
At these levels, the market is pricing in expectations for Uniform ROA to fall from 18% in 2018 to 3% in 2023, accompanied by a 3% Uniform asset shrinkage going forward.
However, analysts project Uniform ROA to remain at 18% through 2020, accompanied by a similar 3% Uniform asset shrinkage.
Foxconn’s profitability is actually better than you think it is
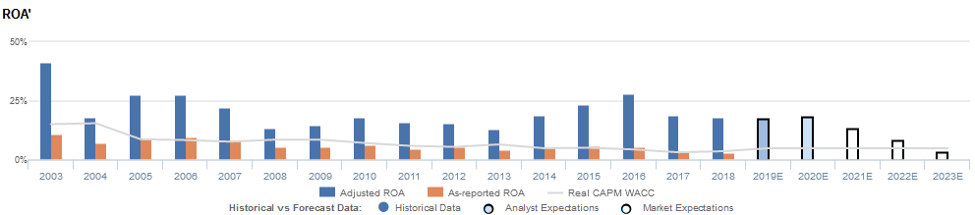
Foxconn’s profitability has been cyclical, with Uniform ROA ranging from 13% to 41% over the past 16 years.
Uniform ROA fell from historical highs of 41% in 2003 to 18% in 2004, before rebounding to 28% in 2005. Afterwards, it decreased to 14% in 2008, remaining at 13% to 18% levels until 2013. Uniform ROA slowly rose to 28% in 2016, but dropped to 18% in 2018.
Meanwhile, Uniform asset growth has been positive in nine of the past 16 years, while ranging from -15% to 185%.
As-reported metrics are understating Foxconn’s profitability.
For example, as-reported ROA was 3% in 2018, a far cry from Uniform ROA of 18%, making the company look like a weaker business than real economic metrics highlight.
Moreover, as-Reported ROA has been below Uniform ROA for the past 16 years, significantly distorting the market’s perception of the firm’s historical profitability trends.
Foxconn’s turns are stronger than you think
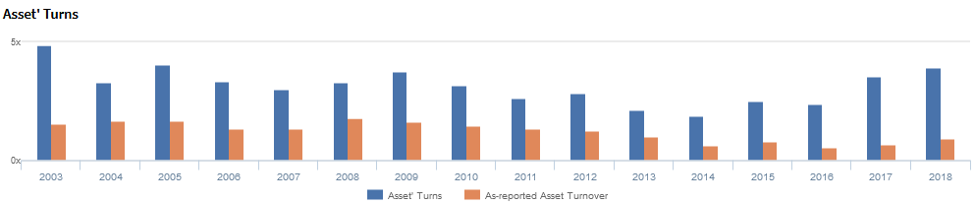
Cyclicality in Uniform ROA has been driven primarily by trends in Uniform asset turns, with peaks and troughs lining up historically with that of Uniform ROA.
Uniform asset turns dropped from a historical high of 4.9x in 2003 to 3.3x in 2004, before stabilizing at 3.0x to 4.0x from 2004 to 2010. Afterwards, Uniform asset turns slowly decreased to a historical low of 1.9x in 2014, before rising to 4.0x in 2018. At current valuations, markets are pricing in expectations for Uniform asset turns to decrease.
Summary and Foxconn Tearsheet
As the Uniform Accounting tearsheet for Foxconn highlights, they are trading at 2.8x Uniform P/E, which is well below market average valuations but slightly above historical average levels.
Low P/Es require low EPS growth to sustain them. In the case of Foxconn, the company has recently shown a 23% decline in Uniform EPS growth.
Sell-side analysts provide stock and valuation recommendations that in general provide very poor guidance or insight. However, sell-side analysts’ near-term earnings forecasts tend to have relevant information.
We take sell-side forecasts for Taiwan Financial Supervisory Commission: International Financial Reporting Standards (TIFRS) earnings and convert them to Uniform earnings forecasts. When we do this, Foxconn’s sell-side analyst-driven forecast is for Uniform earnings to fall 7% in 2019 and grow by 8% in 2020.
Based on current stock market valuations, we can back into the required earnings growth rate that would justify TWD 61.4 per share. These are often referred to as market embedded expectations.
In order to meet the current market valuation levels of Foxconn, the company would have to have Uniform earnings shrink by 34% each year over the next three years. What sell-side analysts expect for Foxconn earnings growth falls well above what the current stock market valuation requires.
To conclude, Foxconn’s Uniform earnings growth is below peer averages in 2020. However, the company is trading below average peer valuations.
The company’s earning power, based on its Uniform return on assets calculation, is well above corporate averages. Furthermore, with cash flows and cash on hand consistently exceeding obligations, Foxconn has low credit and dividend risk.
About the Philippine Market Daily
“Wednesday Uniform Earning Tearsheets – Asia-listed Focus”
Some of the world’s greatest investors learned from the Father of Value Investing or have learned to follow his investment philosophy very closely. That pioneer of value investing is Professor Benjamin Graham. His followers:
Warren Buffett and Charles Munger of Berkshire Hathaway; Shelby C. Davis of Davis Funds; Marty Whitman of Third Avenue Value Fund; Jean-Marie Eveillard of First Eagle; Mitch Julis of Canyon Capital; just to name a few.
Each of these great investors studied security analysis and valuation, applying this methodology to manage their multi-billion dollar portfolios. They did this without relying on as-reported numbers.
Uniform Adjusted Financial Reporting Standards (UAFRS or Uniform Accounting) is an answer to the many inconsistencies present in GAAP and IFRS, as well as in PFRS.
Under UAFRS, each company’s financial statements are rebuilt under a consistent set of rules, resulting in an apples-to-apples comparison. Resulting UAFRS-based earnings, assets, debts, cash flows from operations, investing, and financing, and other key elements become the basis for more reliable financial statement analysis.
Every Wednesday, we focus on one company listed in Asia that’s relevant to the Philippines and that’s particularly interesting from a UAFRS vs as-reported standpoint. We highlight one adjustment that illustrates why the as-reported numbers are unreliable.
This way, we gain a better understanding of the factors driving a particular stock’s returns, and whether or not the firm’s true profitability is reflected in its current valuations.
Hope you’ve found this week’s Uniform Earning Tearsheet on a Philippine company interesting and insightful.
Stay tuned for next week’s Asia company highlight!
Regards,
Angelica Lim & Joel Litman
Research Director & Chief Investment Strategist
Philippine Markets Daily
Powered by Valens Research
www.valens-research.com