
This company might be a diamond in the rough, with a Uniform ROA of 35%, which is much higher than its as-reported 13%!

China’s rapid economic development in the last 40 years has made it a giant market for luxury items. The rise of a richer middle class has fueled a culture of consumers displaying their success through luxury goods.
This Chinese company is taking advantage of this trend, as one of the major players in the expensive jewelry industry.
Uniform Accounting indicates that this company’s Uniform return on assets (ROA) deserves more recognition than it is getting since its profitability is higher than what as-reported metrics show.
Also, below, Uniform Accounting Embedded Expectations Analysis and the Uniform Accounting Performance and Valuation Tearsheet for the company.
Philippine Markets Daily:
Wednesday Uniform Earnings Tearsheets – Asia-listed Focus
Powered by Valens Research
In China, consumers’ appetite for anything luxurious is apparent. According to McKinsey, China accounts for half the growth of the luxury goods spending from 2012 to 2018. It is expected to contribute about 65% of the global additional spending in 2025.
The effects of the trade war between the US and China have led Chinese consumers to make their luxury purchases locally, instead of shopping in neighboring countries. Additionally, the millennials’ willingness to purchase luxury brands and their financial capacity to do so is driving the growth of the market.
Online luxury sales, another key driver of growth, are also increasing. The rapid rise of the richer middle class in China continues to produce first-time consumers of luxury goods.
One of the most sought after luxurious goods in China is jewelry. In 2017, global diamond sales increased by 2% in US dollar terms. According to Statista, the global luxury jewelry market amounting to over 21 billion euros in 2019 can be mainly attributed to China, followed by the United States, Japan, and India.
In China, one of the most prominent jewelry brands is Chow Tai Seng Jewellery Co., Ltd. After more than 20 years in the industry, the company has established itself as an influential brand, receiving numerous accolades including the “2019 Industry Contribution Award” from World Brand Lab.
This prestigious award is recognized as a “Chinese Brand Oscar” and it has commended Chow Tai Seng for its ability to adapt to changing consumer preferences.
One such way Chow Tai Seng highlights this adaptability is through the “experience inspired jewelry” which classifies product style into five categories: natural, charming, romantic, elegant, and modern.
Chow Tai Seng’s strategy as a franchise management firm that focuses more on its brand image by exploring fashion trends, as well as consumer psychology and habits, has proven effective in generating profitability.
In 2019, Chow Tai Seng reported a 20% increase in operating income and a 12% increase in revenue compared with 2018 results. By the end of 2019, the company reached 4,011 stores in China, nearly 20% more stores than the year before.
In response to the pandemic, the company accelerated its digital presence and continued to invest in its marketing and jewelry designs. Moreover, Chow Tai Seng plans to reduce its franchise management fees to aid its franchisees in reaching their sales quotas.
Considering the company’s proven track record of successfully taking advantage of market trends, its as-reported returns of 13% in 2019 is weaker than what it actually is.
Chow Tai Seng’s real economic profitability is better reflected with Uniform Accounting adjustments, which shows its TRUE earning power.
What as-reported metrics fail to do is to consider the company’s excess cash on the balance sheet. While most companies inherently need some level of cash to operate, the portion of that balance that is earning limited or no return—or excess cash—ends up diluting as-reported ROAs.
If excess cash remains included in the company’s asset base in computing its performance metrics, the company’s profitability and capital efficiency may appear weaker than it actually is.
Over the past nine years, Chow Tai Seng has had a significant amount of excess cash sitting idly in its balance sheet, ranging from 9% to 31% of its unadjusted total assets.
After excess cash and other significant adjustments are made, the company actually had a 35% Uniform ROA in 2019, which is almost 3x stronger than their as-reported ROA of 13%.
Chow Tai Seng’s valuations are cheaper than corporate averages

Chow Tai Seng Jewellery Co., Ltd. (002867:CHN) currently trades below corporate averages at a 17.7x Uniform P/E (blue bars), below its as-reported P/E of 20.7x (orange bars).
At these levels, the market is pricing in expectations for Uniform ROA to fall to 22% in 2024, accompanied by 12% Uniform asset growth going forward.
Analysts have more bullish expectations, projecting Uniform ROA to increase to 37% levels in 2021, accompanied by a 5% Uniform asset growth.
Chow Tai Seng’s profitability is much better than you think it is
As-reported metrics are distorting the market’s perception of the firm’s profitability.
If you were to just look at as-reported ROA, you would think that the company is a weaker business than real economic metrics highlight.
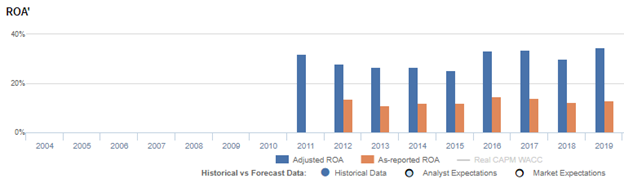
Chow Tai Seng’s Uniform ROA has actually been higher than its as-reported ROA in the past nine years. For example, as-reported ROA is 13% in 2019, significantly lower than its Uniform ROA of 35%. When Uniform ROA reached 34% in 2016, as-reported ROA was just at 15%. The company’s Uniform ROA for the past nine years has ranged from 25% to 35%, while as-reported ROA ranged only from 11% to 15% in the same timeframe.
Chow Tai Seng’s Uniform earnings margins are weaker than you think but its robust Uniform asset turns make up for it

Volatility in Uniform ROA has been driven by trends in Uniform asset turns, and to a lesser extent, by Uniform earnings margins, with peaks and troughs lining up historically with that of Uniform ROA.
Uniform earnings margins fell from 15% in 2011 to 11% in 2013, before gradually increasing to an all-time high of 18% in 2019.
Meanwhile, Uniform asset turns increased from 2.2x in 2011 to a historical high of 2.5x in 2013, before falling back to 2.0x in 2014. It then gradually recovered to 2.2x in 2017, before declining back to 1.9x in 2019.
SUMMARY and Chow Tai Seng Jewellery Co., Ltd. Tearsheet
As the Uniform Accounting tearsheet for Chow Tai Seng Jewellery Co., Ltd. (002867:CHN) highlights, the Uniform P/E trades at 17.7x, which is below corporate average valuation levels but above its own recent history.
Low P/Es require low EPS growth to sustain them. In the case of Chow Tai Seng, the company has recently shown a 21% Uniform EPS growth.
Sell-side analysts provide stock and valuation recommendations that in general provide very poor guidance or insight. However, sell-side analysts’ near-term earnings forecasts tend to have relevant information.
We take sell-side forecasts for Chinese Accounting Standards (CAS) earnings and convert them to Uniform earnings forecasts. When we do this, Chow Tai Seng’s sell-side analyst-driven forecast is 11% and 19% earnings growth in 2020 and 2021, respectively.
Based on current stock market valuations, we can use earnings growth valuation metrics to back into the required growth rate to justify Chow Tai Seng’s CNY 29.50 stock price. These are often referred to as market embedded expectations.
The company can have Uniform earnings grow immaterially each year over the next three years and still justify current prices. What sell-side analysts expect for Chow Tai Seng’s earnings growth is above what the current stock market valuation requires in 2020 and 2021.
The company’s earning power is 6x the corporate average. Also, cash flows are almost 5x higher than its total obligations—including debt maturities, capex maintenance, and dividends. Together, this signals low credit and dividend risk.
To conclude, Chow Tai Seng’s Uniform earnings growth and valuations are in line with its peer averages in 2019.
About the Philippine Market Daily
“Wednesday Uniform Earnings Tearsheets – Asia-listed Focus”
Some of the world’s greatest investors learned from the Father of Value Investing or have learned to follow his investment philosophy very closely. That pioneer of value investing is Professor Benjamin Graham. His followers:
Warren Buffett and Charles Munger of Berkshire Hathaway; Shelby C. Davis of Davis Funds; Marty Whitman of Third Avenue Value Fund; Jean-Marie Eveillard of First Eagle; Mitch Julis of Canyon Capital; just to name a few.
Each of these great investors studied security analysis and valuation, applying this methodology to manage their multi-billion dollar portfolios. They did this without relying on as-reported numbers.
Uniform Adjusted Financial Reporting Standards (UAFRS or Uniform Accounting) is an answer to the many inconsistencies present in GAAP and IFRS, as well as in PFRS.
Under UAFRS, each company’s financial statements are rebuilt under a consistent set of rules, resulting in an apples-to-apples comparison. Resulting UAFRS-based earnings, assets, debts, cash flows from operations, investing, and financing, and other key elements become the basis for more reliable financial statement analysis.
Every Wednesday, we focus on one company listed in Asia that’s relevant to the Philippines and that’s particularly interesting from a UAFRS vs as-reported standpoint. We highlight one adjustment that illustrates why the as-reported numbers are unreliable.
This way, we gain a better understanding of the factors driving a particular stock’s returns, and whether or not the firm’s true profitability is reflected in its current valuations.
Hope you’ve found this week’s Uniform Earning Tearsheet on an Asian company interesting and insightful.
Stay tuned for next week’s Asia company highlight!
Regards,
Angelica Lim
Research Director
Philippine Markets Daily
Powered by Valens Research
www.valens-research.com