
This property developer continues to offer shopping convenience for everyone. A 9% Uniform ROA suggests this company’s got it all.

“Come on in, look at what we got. There so much more and such a lot. Here at SM, we got it all…”
Arguably the most famous company jingle, every Filipino encounters this tune whenever they step into this supermall chain.
Everyone knows the rags-to-riches story of this supermall developer. However, not everyone may know the level of profitability the company continues to generate, which as-reported metrics understate.
Also below, Uniform Accounting Embedded Expectations Analysis and the Uniform Accounting Performance and Valuation Tearsheet for the company.
Philippine Markets Daily:
Tuesday Uniform Earnings Tearsheets – Philippine-listed Focus
Powered by Valens Research
It is no surprise to many of us that 5 of the top 20 largest shopping malls in the world are located here in the Philippines.
With the lack of public spaces, we’ve come to treat malls as the go-to place when we step out of our homes. No longer do they simply contain store kiosks, but they have also evolved to contain chapels, government offices, and many other establishments.
Many different supermall chains are located across the country, but none are as big as SM supermalls.
SM Prime Holdings, Inc. (SMPH:PHL), which handles the SM supermall business, is the largest mall operator in the country. Aside from developing shopping malls, it also has residential properties, offices, hotels, and convention centers.
Before malls became prominent in the city of Manila, there were only various department stores on the street that people went to until the 1950s. One of those stores was a shoe shop established by the young entrepreneur, Henry Sy.
As the population of the city grew, this young businessman anticipated the potential difficulties in serving the increasing number of customers.
For this reason, he travelled to the United States not only to look for shoe stock but also to observe how shops were changing to meet new conditions.
In 1960, he decided to open the first Shoemart in Makati as part of the Makati Commercial Center. The center was an open-air mall with several parking lots and cinemas, although not fully integrated with the rest of the complex.
The next few years, malls in the United States drastically improved, and by the 1970s, malls became multi-story and air-conditioned establishments with their own cineplexes and food courts.
Henry Sy saw this change and predicted that this was going to be the trend in Manila. As such, he tried to partner with established development firms to build the new kind of mall he had in mind but no one was willing to take the risk.
After he expanded his shoemart until the 1980s, he took on the risk of building his first mall. Five years later, the first-ever SM Shopping Center was opened, called the SM North Edsa. This was followed by the establishment of the SM Centerpoint in 1990, SM Megamall in 1991, and SM City Cebu in 1993.
After successfully building those malls, Henry Sy incorporated this company and named it SM Prime Holdings in 1994.
SM Prime continued to expand its number of supermalls since after its IPO in July 1994. Today, there are currently a total of 60 malls in the country and seven malls in China.
One of the notable modern complexes the company made is the SM Mall of Asia, which eventually became a tourist destination for being one of the largest in the world at the time of opening.
The company’s wide expansion and increasing foot traffic enabled them to grow their revenues.
With the profit the company earned, SM Prime expanded into other real estate business such as SM Development Corporation (SMDC), SM Prime’s Commercial Properties Group (CPG), and SM Hotels and Conventions Corporation (SMHCC).
With these developments, the firm became one stock that most long-term investors want to invest in, not only for its large market capitalization but also for its steady long-term cash flow.
Today, however, the global pandemic has disrupted the company’s operation. Since malls are closed during this period with the exception of its supermarkets, SM Prime is unable to collect rent from their mall tenants.
With half of SM Prime’s total revenue coming from these rent collections, investors are concerned about their profitability this year. Since the beginning of the year, the stock has already fallen by 25%.
This bearish sentiment, however, is likely to have been influenced by a misunderstanding of the firm’s TRUE profitability.
As-reported metrics suggest that the company posted a 6% ROA in 2019, whereas by removing the accounting distortions, SM Prime’s Uniform earning power is actually higher at 9%.
One of the said distortions stems from how Philippine Financial Reporting Standards (PFRS) accounts for interest expense.
Based on PFRS, interest expense is an operating cash flow, but in reality, interest expense represents the cost of debt and is rightfully a financing cash flow. As such, in Uniform Accounting, interest expense is added back to earnings.
For example, in 2019, SM Prime recognized an interest expense of PHP 8.8 billion, 23% of its as-reported net income of PHP 38.1 billion.
After adding the PHP 8.8 billion back to earnings, net income increases, and with the many other adjustments Valens makes, we arrive at a TRUE earning power of 9%.
SM Prime’s earning power is stronger than you think
As-reported metrics distort the market’s perception of the firm’s profitability.
If you were to just look at as-reported ROA, you would think that the company is a weaker business than real economic metrics highlight.
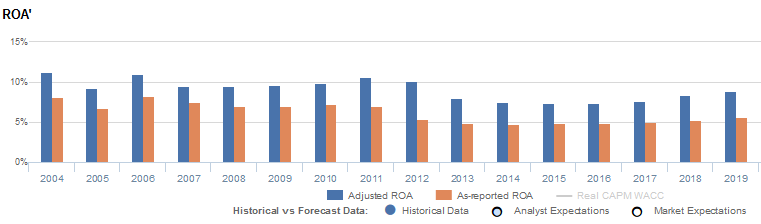
Uniform ROA has actually been higher than as-reported ROA for the past sixteen years. For example, Uniform ROA was 9% in 2019, significantly higher than as-reported ROA of 6%.
In addition, Uniform ROA expanded from 7% in 2015 to current 9% levels, while as-reported ROA only improved from 5% to 6% over the same period.
Through Uniform Accounting, we see that the firm’s true ROAs have actually been strong. After ranging from 9%-11% levels in 2004-2012, Uniform ROA declined from 8% in 2014 to 7% in 2016. Thereafter, Uniform ROA started to recover and achieved a recent peak of 9% in 2019.
Although as-reported ROA is trending similarly with Uniform metrics, traditional ROAs are far lower than true ROAs. As-reported metrics subsequently declined from 8% in 2004 to 5% in 2012. Since then, as-reported ROA has fallen further to below cost-of-capital until 2018, before recovering to 6% levels in 2019.
SM Prime’s earnings margin is weaker than you think
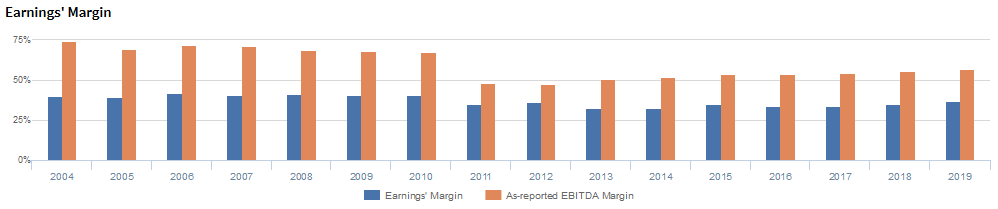
Trends in Uniform ROA have been driven by trends in Uniform earnings margin. From 2004 to 2010, Uniform margins ranged from 40%-42% before declining to 35% in 2011.
Then, Uniform margin gradually declined to low levels of 33% in 2014, before slowly recovering to 35% in 2015 and achieving new highs of 37% in 2019.
At current valuations, markets are pricing in expectations for continued stability in Uniform Turns, but also a further reduction in Uniform Margins.
SUMMARY and SM Prime Holdings, Inc. Corporation Tearsheet
As our Uniform Accounting tearsheet for SM Prime highlights, Uniform P/E trades at 29.0x, which is above the market average but below the company’s historical average levels.
High P/Es require high EPS growth to sustain them. In the case of SM Prime, the company has recently shown a strong 23% Uniform EPS growth.
Sell-side analysts provide stock and valuation recommendations that in general provide very poor guidance or insight. However, sell-side analysts’ near-term earnings forecasts tend to have relevant information.
We take sell-side forecasts for PFRS earnings and convert them to Uniform earnings forecasts. When we do this, SM Prime’s sell-side analyst-driven forecast is a 16% Uniform earnings shrinkage in 2020, followed by 37% Uniform earnings growth in 2021.
Based on current stock market valuations, we can back into the required earnings growth rate that would justify PHP 31.00 per share. These are often referred to as market embedded expectations.
To meet the current market valuation levels of SM Prime, the company would need to grow its Uniform earnings by 5% each year over the next three years.
What sell-side analysts expect for SM Prime’s earnings growth is below the current stock market valuation required in 2020.
The company’s earning power is above the corporate average, and the company has high dividend risk, with cash flow and cash on hand falling short of obligations within five years.
To conclude, SM Prime’s Uniform earnings growth is below peer averages in 2020 and the company is trading above peer valuations.
About the Philippine Markets Daily
“Tuesday Uniform Earnings Tearsheets – Philippine-listed Focus”
Some of the world’s greatest investors learned from the Father of Value Investing or have learned to follow his investment philosophy very closely. That pioneer of value investing is Professor Benjamin Graham. His followers:
Warren Buffett and Charles Munger of Berkshire Hathaway; Shelby C. Davis of Davis Funds; Marty Whitman of Third Avenue Value Fund; Jean-Marie Eveillard of First Eagle; Mitch Julis of Canyon Capital; just to name a few.
Each of these great investors studied security analysis and valuation, applying this methodology to manage their multi-billion dollar portfolios. They did this without relying on as-reported numbers.
Uniform Adjusted Financial Reporting Standards (UAFRS or Uniform Accounting) is an answer to the many inconsistencies present in GAAP and IFRS, as well as in PFRS.
Under IFRS, each company’s financial statements are rebuilt under a consistent set of rules, resulting in an apples-to-apples comparison. Resulting UAFRS-based earnings, assets, debts, cash flows from operations, investing, and financing, and other key elements become the basis for more reliable financial statement analysis.
Every Tuesday, we focus on one Philippine-listed company that’s particularly interesting from a UAFRS vs as-reported standpoint. We highlight one adjustment that illustrates why the as-reported numbers are unreliable.
This way, we gain a better understanding of the factors driving a particular stock’s returns, and whether or not the firm’s true profitability is reflected in its current valuations.
Hope you’ve found this week’s Uniform Earnings Tearsheet on a Philippine company interesting and insightful.
Stay tuned for next week’s Philippine company highlight!
Regards,
Angelica Lim & Joel Litman
Research Director & Chief Investment Strategist
Philippine Markets Daily
Powered by Valens Research
www.valens-research.com


