
Uniform Accounting reveals that the ROA of the companies this UITF invests in is nearly twice as much as its as-reported metrics!

In its first three years since inception, this unit investment trust fund (UITF) and its benchmark, the Philippine Stock Exchange Index (PSEi), have been neck-and-neck.
This was then followed by six years of the UITF outperforming the PSEi, before the PSEi surpassed the fund from 2015-2017. For the past three years, however, both have been neck-and-neck once again.
As-reported metrics would leave investors confused with the fund’s stock picks. However, Uniform Accounting financial metrics help make sense of the fund’s investments.
In addition to examining the fund’s portfolio, we are including fundamental analysis of one of the fund’s largest holdings, providing you with the current Uniform Accounting Performance and Valuation Tearsheet for that company.
Philippine Markets Daily:
Friday Uniform Portfolio Analytics
Powered by Valens Research
Rizal Commercial Banking Corporation (RCBC) is one of the Philippines’ top universal banks. It was established in 1960 as a development bank, and eventually became one of the go-tos in commercial and investment banking. Currently, its total assets are valued at PHP 771.3 billion.
In March 2005, RCBC introduced a variety of UITFs for its investors. One of these UITFs is the Rizal Equity Fund. Its investment strategy is to invest in local equities and initial public offerings listed in the Philippine Stock Exchange (PSE).
The Rizal Equity Fund rose from a net asset value per unit (NAVPU) of PHP 1.00 in March 2005 to a record PHP 4.28 in January 2018, delivering a 428% investment growth since its inception.
However, that initial run was cut short due to various concerns such as Brexit and the U.S.-China trade war. The fund fell 19% from its January 2018 peak to PHP 3.47 in October 2018. However, the PSEi had a worse loss of 24% in the same period.
Earlier this year, the local market was impacted by the Taal eruption and COVID-19. As it was uncertain when the public health crisis would be averted, the fund’s strategy was to limit its holdings to big-cap stocks and invest in more resilient and in-demand sectors such as consumer staples and telcos.
After ending 2019 with a NAVPU of PHP 3.87, the fund plunged to a 2020 low of PHP 2.34. It has since settled at PHP 2.89 as of August 3, 2020. Year to date, the fund and the PSEi are down by 25% and 27%, respectively.
Looking at Rizal Equity Fund’s investments using as-reported metrics, it is not apparent that the fund invests in high-growth companies.
As-reported metrics would have investors believe that this portfolio consists of companies that do not generate economic profit. However, Uniform Accounting reveals the truth behind the companies this fund invests in.
The table below shows the core non-financial holdings of the Rizal Equity Fund along with their Uniform return on assets (ROA), as-reported ROA, and ROA distortion—the difference between Uniform and as-reported ROA.
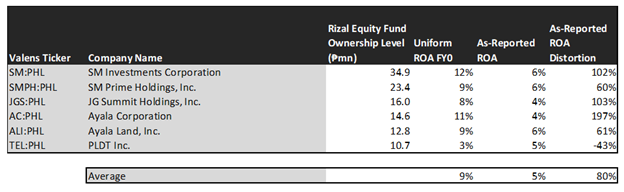
All of the companies in the Rizal Equity Fund show as-reported ROAs that range around and below global cost-of-capital levels, suggesting that they are not generating economic profit. In 2019, the fund generated an average as-reported ROA of 5%, in line with global corporate average returns of 6%.
However, on a Uniform Accounting basis, this UITF has actually delivered stronger earnings with an average Uniform ROA of 9%, nearly 2x what as-reported metrics suggest. These companies have strong returns, with Uniform ROA above 6% global average returns except for PLDT Inc. (TEL:PHL).
The Uniform Accounting framework addresses financial statement inconsistencies attributable to the flaws present in the Philippine Financial Reporting Standards (PFRS). This enables investors to determine the true underlying performance of companies and avoid distorted financial analysis and valuation.
As such, it should not be surprising that when analyzing the non-financial holdings of the fund, the figures that easily stand out are the large discrepancies between Uniform ROA and as-reported ROA for these companies.
While at a glance, the difference between as-reported ROA and Uniform ROA may not seem material, the distortion in percentage ranges from -43% to 197%, with Ayala Corporation (AC:PHL), JG Summit Holdings, Inc. (JGS:PHL), and SM Investments Corporation (SM:PHL) all having distortions above a hundred percent.
As-reported ROA understates the profitability of AC, suggesting a below-average company with an as-reported ROA of 4%. In reality, this leading conglomerate is a high-quality firm with an 11% Uniform ROA, almost thrice the as-reported number. Over the past 15 years, AC has never seen its Uniform ROA dip below 10%.
Similarly, JG Summit Holdings, Inc. (JGS:PHL) is not just a 4% ROA firm like what as-reported numbers suggest. It is, in fact, an above-average company with an 8% Uniform ROA, consistently generating above-average returns over the past five years.
By focusing on as-reported metrics alone, RCBC would never pick most of these companies because they look like anything but profitable businesses.
That said, looking at profitability alone is insufficient to deliver superior investment returns. Investors should also identify if the market is significantly undervaluing the company’s earnings growth potential.
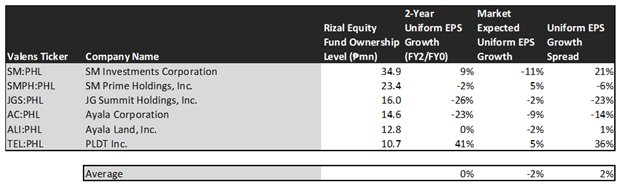
This table shows the earnings growth expectations for the major non-financial holdings of the fund. It features three key data points:
- The 2-year Uniform earnings per share (EPS) growth represents the Uniform earnings growth the company is likely to have for the next two years. The earnings number used is the value of when we convert consensus sell-side analyst estimates to the Uniform Accounting framework.
- The market expected Uniform EPS growth represents what the market thinks Uniform earnings growth is going to be for the next two years. Here, we show by how much the company needs to grow Uniform earnings in the next two years to justify the current stock price of the company. This is the market’s embedded expectations for Uniform earnings growth.
- The Uniform EPS growth spread is the difference between the 2-year Uniform EPS growth and market expected Uniform EPS growth.
On average, Philippine companies are expected to have 6% annual Uniform earnings growth over the next two years. Meanwhile, Rizal Equity Fund’s major holdings are forecast to underperform with immaterial Uniform earnings growth in the next two years.
The market is seeing a 2% Uniform EPS shrinkage for these firms in the next two years.
Among these companies, TEL and SM have the highest positive Uniform earnings growth dislocation.
The market is expecting TEL’s Uniform earnings to rise by 5%, but analysts are projecting a robust 41% earnings growth for the telecommunication company in the next two years.
Meanwhile, the market is pricing SM’s Uniform Earnings to plummet by 11% in the next two years. However, sell-side analysts are projecting the company’s earnings to accelerate by 9% moving forward.
Overall, as-reported numbers would have investors incorrectly conclude that this portfolio consists of low-quality companies. While these firms suffer from the adverse effects of the coronavirus pandemic, dragging down their short-term earnings growth expectations, Uniform Accounting metrics show that these companies are high quality with intact business models that would drive economic profitability moving forward.
SUMMARY and SM Prime Holdings, Inc. Tearsheet
Today, we’re highlighting one of the largest individual stock holdings in the Rizal Equity Fund—SM Prime Holdings, Inc. (SMPH:PHL).
As the Uniform Accounting tearsheet for SMPH highlights, it trades at a Uniform P/E of 29.2x, above the global corporate average P/E of 21.7x, but below its historical average of 33.0x.
High P/Es require high EPS growth to sustain them. In the case of SMPH, the company has recently shown a 23% Uniform EPS growth.
Sell-side analysts provide stock and valuation recommendations that poorly track reality. However, sell-side analysts have a strong grasp on near-term financial forecasts like revenue and earnings.
We take sell-side forecasts for PFRS earnings as a starting point for our Uniform earnings forecasts. When we do this, SMPH’s sell-side analyst-driven forecast shows that Uniform earnings is expected to decline by 29% in 2020, before accelerating by 36% in 2021.
Based on the current stock market valuations, we can back into the required earnings growth rate that would justify PHP 30.00 per share. These are often referred to as market embedded expectations.
The company would have to see Uniform earnings expand by 5% each year over the next three years to meet current market valuation levels. Sell-side analysts’ expected 36% Uniform EPS growth for SMPH is well above what the current stock market valuation requires.
The company has an earning power that has consistently been above global long-run corporate averages—based on its Uniform ROA calculation. However, with cash flows and cash on hand falling short of obligations within five years, SMPH has a high dividend risk.
To conclude, SMPH’s Uniform earnings growth is around peer averages. However, the company is trading well above peer average valuations.
About the Philippine Market Daily
“Friday Uniform Portfolio Analytics”
Investors who don’t engage in the buying or selling of securities for a living oftentimes rely on professionals to manage their own investments within the scope of their investment policies.
With so many funds and managers out there, it can get confusing and difficult to decide which one best suits your needs as an investor.
Every Friday, we focus on one fund in the Philippines and take a deeper look into their current holdings. Using Uniform Accounting, we identify the high-quality stocks in their portfolio which may not be obvious using the as-reported numbers.
We also identify which holdings may be problematic for the fund’s returns that they would need to reconsider from a UAFRS perspective.
To wrap up the fund analysis, we highlight one of their largest holdings and focus on key metrics to watch out for, accessible in our tearsheets.
Hope you’ve found this week’s focus on Rizal Equity Fund interesting and insightful.
Stay tuned for next week’s Friday Uniform Portfolio Analytics!
Regards,
Angelica Lim
Research Director
Philippine Markets Daily
Powered by Valens Research
www.valens-research.com


