
Uniform Accounting shows how starting many construction projects should impact profitability, with this developer’s TRUE ROAs declining each year

Measuring a company’s return on assets (ROA) is one of the most popular ways of identifying a firm’s efficiency. However, without proper context, it can distort the analysis and lead to the wrong conclusion.
The failure to get the true ROAs trend will also have a similar impact. This homebuilder’s true ROAs are on a decline, but still at levels higher than as-reported ROA.
Also below, Uniform Accounting Embedded Expectations Analysis and the Uniform Accounting Performance and Valuation Tearsheet for the company.
Philippine Markets Daily:
Tuesday Uniform Earnings Tearsheets – Philippine-listed Focus
Powered by Valens Research
When choosing a market to compete in, selecting the smaller market is sometimes the wiser choice.
While the pie is smaller, existing companies often enjoy a bigger slice because newer companies find it difficult to only have crumbs to initially work with. In contrast to a larger market, an entrant can easily make ends meet with even a tiny share.
This has been the strategy of Cebu Landmasters, Inc. (CLI:PHL). As its name suggests, the company leads the housing development market in Cebu City and the Visayas island group in general.
While the housing market in Visayas is smaller compared to NCR, Cebu Landmasters has developed a strong foothold in the fast-growing space. The company has become the top choice for buyers, even earning them the 2019 award for Best Developer in the Philippines.
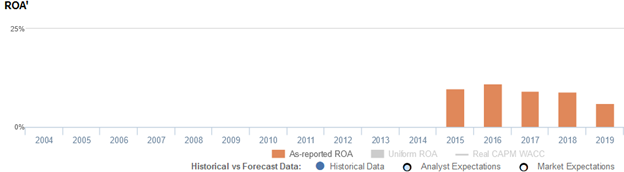
Looking at as-reported metrics, you’ll see a company whose returns have been relatively stable and above the cost of capital. This implies that the company is able to grow its net income each year at a rate similar to the growth of its assets.
However, one of the characteristics of the Real Estate sector is the large fixed costs companies need to operate. Since 2016, the company has been growing its assets by at least 80% annually–nearly doubling its assets each year.
Furthermore, Cebu Landmasters has recently ramped up its construction costs with 65 projects under development as of the end of 2019. As such, much of the firm’s assets are properties under construction which takes years to begin generating revenue.
When the properties do start generating revenue, most customers do not pay in lump sum and opt to pay in installments instead, spread out over years and even decades.
Using Uniform Accounting metrics, you’ll see Cebu Landmasters’ ROA reflects that reality of being a real estate developer. From 2014 to 2019, Uniform ROA has steadily eroded from 23% to 7%.

The company looks like an underperforming business, but given its context, its profitability trend actually seems reasonable.
That said, as-reported metrics still understate the company’s true earning power. Despite the downward trend, Cebu Landmasters’ 7% Uniform ROA in 2019 is still above as-reported ROA of 6% the same year.
What as-reported metrics fail to consider is how current liabilities should be factored into the ROA calculation. Traditional ROA calculations for measuring a firm’s earning power only include current and long-term assets as part of the cost of investment.
However, a company’s ability to receive goods and services in advance of payments – the current operating liabilities – ought to be factored in as well.
Current liabilities (excluding short-term debt) are necessary for operations. Items such as accounts payable, accrued expenses, and others are used to maintain the firm’s current capital position. On the other hand, long-term liabilities are mostly just used to finance the business.
If a company has a ton of cash to service its current liabilities and we only factor in its cash, it would make the company look inefficient. In reality, the company is just being responsible by building liquid assets to meet short-term obligations.
As such, net working capital (current assets – current liabilities) is used for the firm’s ROA calculation. This shows a company’s real cash management ability and thereby, its true earning power.
In the case of Cebu Landmasters, current liabilities have hovered around 11%-25% of the firm’s total as-reported assets since 2015.
Subtracting current liabilities from Cebu Landmasters’ assets, along with the many other necessary adjustments made, leads to a 7% Uniform ROA in 2019, still higher than its as-reported ROA of 6%.
Cebu Landmasters’ earning power is declining, but still stronger than you think

As-reported metrics distort the market’s perception of the firm’s historical profitability. If you were to just look at as-reported ROA, you would think Cebu Landmasters’ profitability has been weaker than real economic metrics have highlighted in the past five years.
In reality, Cebu Landmasters’ true profitability has been higher than as-reported ROA since 2015. Specifically in 2017, the year of the company’s IPO, Uniform ROA was 13% but as-reported ROA was only 9% that year.
The company’s as-reported was sustained at 9%-11% levels from 2015-2018, before dropping to 6% in 2019. Meanwhile, since 2014, Uniform ROA has steadily contracted from 23% to 7%.
Cebu Landmasters’ asset turns are stronger than you think

Strength in Cebu Landmasters’ Uniform ROA has been driven by strong Uniform asset turns. In fact, Uniform turns have been higher than as-reported turns in five of the past six years.
After peaking at 0.5x in 2014, as-reported turns faded to 0.2x in 2019. Meanwhile, since 2014, Uniform turns have eroded from 0.7x to 0.3x.
Looking at the firm’s turns alone, as-reported metrics are making the firm appear to be a less asset efficient business than is accurate.
SUMMARY and Cebu Landmasters, Inc. Tearsheet
As the Uniform Accounting tearsheet for Cebu Landmasters highlights, it trades at a Uniform P/E of 16.6x, below the global corporate average of 25.2x but above its historical average of 11.8x.
Low P/Es require low EPS growth to sustain them. In the case of Cebu Landmasters, the company has recently shown a 15% Uniform EPS growth.
Sell-side analysts provide stock and valuation recommendations that provide very poor guidance or insight in general. However, sell-side analysts’ near-term earnings forecasts tend to have relevant information.
We take sell-side forecasts for Philippine Financial Reporting Standards (PFRS) earnings and convert them to Uniform earnings forecasts. When we do this, Cebu Landmasters’ sell-side analyst-driven forecast calls for a Uniform EPS decline of 13% in 2020 and 12% in 2021.
Based on current stock market valuations, we can use earnings growth valuation metrics to back into the required growth rate to justify Cebu Landmasters’ PHP 4.96 stock price. These are often referred to as market embedded expectations.
The company can have Uniform earnings shrink by 3% each year over the next three years and still justify current valuations. What sell-side analysts expect for Cebu Landmasters’ earnings growth is below what the market requires in 2020 and 2021.
Furthermore, the company’s earning power is near the long-run corporate average, and cash flows and cash on hand are slightly below its total obligations—including debt maturities, capex maintenance, and dividends. Together, this signals moderate credit and dividend risk.
To conclude, Cebu Landmasters’ Uniform earnings growth is below peer averages and the company is trading above peer average valuations.
About the Philippine Markets Daily
“Tuesday Uniform Earnings Tearsheets – Philippine-listed Focus”
Some of the world’s greatest investors learned from the Father of Value Investing or have learned to follow his investment philosophy very closely. That pioneer of value investing is Professor Benjamin Graham. His followers:
Warren Buffett and Charles Munger of Berkshire Hathaway; Shelby C. Davis of Davis Funds; Marty Whitman of Third Avenue Value Fund; Jean-Marie Eveillard of First Eagle; Mitch Julis of Canyon Capital; just to name a few.
Each of these great investors studied security analysis and valuation, applying this methodology to manage their multi-billion dollar portfolios. They did this without relying on as-reported numbers.
Uniform Adjusted Financial Reporting Standards (UAFRS or Uniform Accounting) is an answer to the many inconsistencies present in GAAP and IFRS, as well as in PFRS.
Under IFRS, each company’s financial statements are rebuilt under a consistent set of rules, resulting in an apples-to-apples comparison. Resulting UAFRS-based earnings, assets, debts, cash flows from operations, investing, and financing, and other key elements become the basis for more reliable financial statement analysis.
Every Tuesday, we focus on one Philippine-listed company that’s particularly interesting from a UAFRS vs as-reported standpoint. We highlight one adjustment that illustrates why the as-reported numbers are unreliable.
This way, we gain a better understanding of the factors driving a particular stock’s returns, and whether or not the firm’s true profitability is reflected in its current valuations.
Regards,
Angelica Lim
Research Director
Philippine Markets Daily
Powered by Valens Research
www.valens-research.com


