
Uniform Accounting shows how this pizza parlor has been able to keep its mojo, delivering 17%+ TRUE returns each year

Pizza is a favorite staple for gatherings and parties not just because of the variety of flavors available, but also because it is convenient. An 18-inch pizza can easily feed 6 or 7 people. Cut it into criss cross slices and you have enough to serve maybe twice more, making it a great part of a spread at parties.
Unfortunately, the pizza chain market leader wasn’t spared from the coronavirus pandemic. Though the company’s profitability is taking a hit, its returns may still be higher than you think, looking at its true Uniform (UAFRS-based) profitability.
Also below, Uniform Accounting Embedded Expectations Analysis and the Uniform Accounting Performance and Valuation Tearsheet for the company.
Philippine Markets Daily:
Tuesday Uniform Earnings Tearsheets – Philippine-listed Focus
Powered by Valens Research
Historical records indicate that people have been eating pizzas since ancient times. The Romans thought of it as peasant food, simply a piece of flatbread topped with ingredients found in the local woods.
The dish started becoming a staple in 18th-century Naples. The city was rapidly growing in terms of population and trade, so the workers needed food that was affordable and easy to make.
The pizza satisfied such a need. Vendors started to fill up the streets, carrying boxes of the dish to sell to laborers. Often, the pizzas would be cut up depending on the buyer’s desired size.
With the introduction of trade from the Americas, the types of pizzas started to vary. Some even added tomatoes on top, alongside mozzarella cheese and basil. This variation became so popular that it made its way to the tables of Italian royalty, cementing its place in Italian culture.
However, it was the Americans who made pizza famous globally. The influx of Italian immigration in the US and the invention of refrigerators and motorcycles allowed pizza chains to be commercially viable.
The 1950s and 1960s saw the rise of the most well-known pizza chains: Pizza Hut, Shakey’s, and Domino’s. In the following decades, these pizza names would soon expand their operations to the Philippines.
Shakey’s Pizza Asia Ventures, Inc. (PIZZA:PHL) has been operating in the country since 1975, and has been trading on the Philippine Stock Exchange since 2016.
Shakey’s initially marketed in the 1980s as a beer place that offered pizzas and fried chicken on the side. When that failed, the firm attempted to transform into a fast food pizza restaurant, competing against other fast food chains such as McDonald’s and Jollibee.
However, Shakey’s struggled to compete directly in the fast food retail space, forcing the company to rethink its strategy again. With a new set of management in the 2000s, the firm rebranded into what it is today: a family-friendly pizza place catered to middle- and upper-income classes.
Entering the 2010s, Shakey’s newfound strategy finally enabled the firm to find a foothold in the market. At the same time, the rising middle class contributed to the expansion of the industry.
Although the popularity of the industry attracted new entrants to the market like Papa John’s, S&R, and artisan pizza restaurants, Shakey’s nationwide store network enabled the firm to still beat the competition in terms of sales.
Today, Shakey’s claims to be the market leader in chained pizza full service restaurants with its thin crust pizza and Chicken N’ Mojo offerings. The company has been opening new branches each year, but this year, many of the planned store openings have been put on hold as a result of the COVID-19 pandemic.
With the quarantine restrictions, Shakey’s dine-in revenues have been severely crippled year to date. Although the firm has an increase in delivery and takeout orders, this has been insufficient in offsetting the dine-in revenue losses.
As a result of the macro pressures, Shakey’s returns are forecast to drop by half. Looking at the as-reported metrics, such an event may be worrying for the firm since the most recent as-reported ROA is just 8%. An earning power of 4% implies that the firm has failed to generate economic value above the 6% cost of capital.

However, the firm’s Uniform metrics show that returns are still healthy even if forecasts are true. With a Uniform ROA of 20% in 2019, the firm’s true earning power in 2020 would only fall to 10%.
As-reported metrics are materially misrepresenting the firm’s performance, driven by the huge distortion caused by the accounting treatment of goodwill. Since 2016, Shakey’s has been recording over PHP 1 billion of goodwill in the balance sheet each year following the acquisition of Bakemasters, Inc.
Goodwill is a purely accounting-based item and does not actually represent any asset Shakey’s uses for its operations. As a result, the true asset base of Shakey’s has been materially overstated for years.
Removing goodwill along with the other necessary adjustments in Uniform Accounting, Shakey’s should be recognizing PHP 7 billion less in assets and a 20% Uniform ROA in 2019.
Shakey’s earning power is stronger than you think
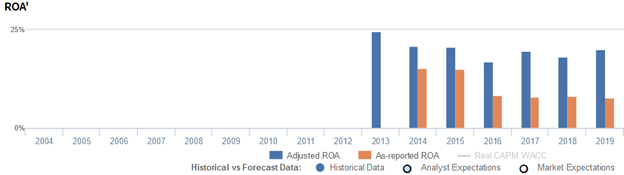
As-reported metrics distort the market’s perception of the firm’s recent profitability. If you were to just look at as-reported ROA, you would think that the company is a much weaker business than real economic metrics highlight.
Shakey’s Uniform ROA has actually been higher than its as-reported ROA for each of the past six years. Most recently, as-reported ROA was 8% in 2019, but Uniform ROA displays a stronger profitability of 20%.
Through Uniform Accounting, we can see that the company is still generating true ROAs above the 6% global corporate average.
As-reported ROA maintained 15% levels from 2014-2015, before falling to 8% levels since then, as the firm acquired Bakemasters, Inc. in 2016. Meanwhile, Uniform ROA faded from 25% in 2013 to 17% in 2016, before recovering to 18%-20% levels through 2019.
Shakey’s asset utilization is more efficient than you think
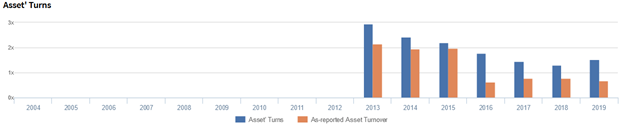
Shakey’s profitability has been driven primarily by stronger asset turns, a key driver of profitability.
As-reported asset turnover fell from 1.9x-2.1x levels in 2013-2015 to a low of 0.6x in 2016, before rebounding to 0.7x-0.8x levels from 2017-2019. Meanwhile, after compressing from a peak of 2.9x in 2013 to a 1.3x trough in 2018, Uniform turns improved to 1.5x in 2019.
As-reported metrics have been making the firm appear to be a less asset efficient business than real economic metrics highlight.
SUMMARY and Shakey’s Pizza Asia Ventures, Inc. Tearsheet
As the Uniform Accounting tearsheet for Shakey’s highlights, the Uniform P/E trades at 21.2x, which is currently below corporate average valuation levels and its own history.
Low P/Es require low EPS growth to sustain them. In the case of Shakey’s, the company has recently shown a 12% Uniform EPS decline.
Sell-side analysts provide stock and valuation recommendations that in general provide very poor guidance or insight. However, sell-side analysts’ near-term earnings forecasts tend to have relevant information.
We take sell-side forecasts for PFRS earnings and convert them to Uniform earnings forecasts. When we do this, Shakey’s sell-side analyst-driven forecast calls for a 72% Uniform EPS decline in 2020 and a 175% Uniform EPS growth in 2021.
Based on current stock market valuations, we can use earnings growth valuation metrics to back into the required growth rate to justify Shakey’s PHP 5.55 stock price. These are often referred to as market embedded expectations.
The company can have its EPS shrink by 8% each year over the next three years and still justify current valuations. What sell-side analysts expect for Shakey’s earnings growth is below what the current stock market valuation requires in 2020, but above its requirement in 2021.
Furthermore, the company’s earning power is 3x the long-run corporate average. Meanwhile, cash flows and cash on hand are above its total obligations—including debt maturities, capex maintenance, and dividends. Together, this signals low credit and dividend risk.
To conclude, Shakey’s Uniform earnings growth is well below peer averages, but the company is trading around its peer average valuations.
About the Philippine Market Daily
“Tuesday Uniform Earnings Tearsheets – Philippine-listed Focus”
Some of the world’s greatest investors learned from the Father of Value Investing or have learned to follow his investment philosophy very closely. That pioneer of value investing is Professor Benjamin Graham. His followers:
Warren Buffett and Charles Munger of Berkshire Hathaway; Shelby C. Davis of Davis Funds; Marty Whitman of Third Avenue Value Fund; Jean-Marie Eveillard of First Eagle; Mitch Julis of Canyon Capital; just to name a few.
Each of these great investors studied security analysis and valuation, applying this methodology to manage their multi-billion dollar portfolios. They did this without relying on as-reported numbers.
Uniform Adjusted Financial Reporting Standards (UAFRS or Uniform Accounting) is an answer to the many inconsistencies present in GAAP and IFRS, as well as in PFRS.
Under IFRS, each company’s financial statements are rebuilt under a consistent set of rules, resulting in an apples-to-apples comparison. Resulting UAFRS-based earnings, assets, debts, cash flows from operations, investing, and financing, and other key elements become the basis for more reliable financial statement analysis.
Every Tuesday, we focus on one Philippine-listed company that’s particularly interesting from a UAFRS vs as-reported standpoint. We highlight one adjustment that illustrates why the as-reported numbers are unreliable.
This way, we gain a better understanding of the factors driving a particular stock’s returns, and whether or not the firm’s true profitability is reflected in its current valuations.
Hope you’ve found this week’s Uniform Earnings Tearsheet on a Philippine company interesting and insightful.
Stay tuned for next week’s Philippine company highlight!
Regards,
Angelica Lim
Research Director
Philippine Markets Daily
Powered by Valens Research
www.valens-research.com