
Uniform Accounting unearths a diamond in the rough, with this jeweler having ROAs that are 7x higher than as-reported

Thanks to one family’s tight control over one of the largest diamond mines in the late 1800s, plus its highly convincing marketing campaign, diamonds have become one of the more expensive gems despite its relative commonness.
But unlike jewelers whose brands revolve around the prestige and exclusivity of diamonds, this jeweler has done the opposite, making it a point to provide consumers with affordable, yet high-quality diamond jewelry.
As-reported metrics make it look like the affordable luxury strategy hasn’t had much consumer appeal, with as-reported return on assets (ROAs) that have fallen from 33% to just 12% currently. In reality, Uniform Accounting shows that the strategy continues to pull in strong demand, with Uniform ROAs sustained at 70%-100% levels.
Also below, Uniform Accounting Embedded Expectations Analysis and the Uniform Accounting Performance and Valuation Tearsheet for the company.
Philippine Markets Daily:
Thursday Uniform Earnings Tearsheets – Global Focus
Powered by Valens Research
Diamonds aren’t actually as valuable as we think they are. A gem’s value is derived from its rarity, and as it turns out, diamonds are actually relatively common. In fact, the only reason why they’re priced more than they should be is because of one company’s supply controls and aggressive marketing campaigns.
In the late 1800s, the De Beers bought one of the largest diamond mines at the time and supplied only enough to meet the market demand.
The De Beers also pushed for a campaign that convinced consumers that a diamond is the only acceptable gem for an engagement ring, coining the slogan “A diamond is forever.” The campaign was massively successful—diamond sales in the US alone went from $20 million to about $2 billion three decades after.
Tight control over the diamond supply and a surge in demand fueled by “tradition” made diamonds seem rarer, thus driving up its perceived value and price. This is how jewelers were able to brand themselves using exclusivity and prestige as their selling points.
That isn’t the case for Pandora (PNDORA:DNK), however, whose brand is focused on providing high-quality, affordable luxury.
Pandora is known for its charm bracelets, where customers can buy a plain bracelet that they then get to personalize by adding in charms. In total, the company’s charms and bracelets business account for about 70% of its total revenues.
The reason why Pandora’s charm bracelets have become popular, especially as a gift option, is because of how they’re marketed—not as a simple accessory, but as emotional tokens to commemorate milestones, or even as an expression of one’s personality.
This marketing strategy is psychologically sound.
People love personalized items, even if it’s something with just their initials engraved on it, because it makes them feel unique. They have a thing no one else in the world has. Although a lot of other people have the same charm, the emotions and personal connection attached to it is what makes it special.
With Pandora offering a selection of about 800 charm designs, it’s likely that a customer would find the exact charm that’s suited for any occasion.
However, while its customized nature is how it sells, its affordability is how they keep selling. Diamond charms retail for about $30-$60, while necklaces, bracelets, and earrings retail for around that price up to $100.
Offering quality jewelry for relatively low prices removes the intimidation factor a customer usually feels when entering jewelry stores. This is why Pandora’s customers feel comfortable making multiple store visits.
Plus, the thing about people with Pandora charm bracelets is, friends or family almost always gift them charms to add to their collection, mostly because it’s an easy and relatively inexpensive but thoughtful gift to give.
So while a bracelet may eventually cost up to $1,000, it usually gets to that price point thanks to a collective effort over time. This helps create demand—and higher revenues—since more people contribute to the bracelet as opposed to a single person who may be reluctant to spend that much.
Looking at as-reported metrics, it seems that Pandora’s marketing strategy for its core product, as well as its general appeal as affordable luxury, hasn’t spurred much demand recently. As-reported return on assets have fallen from a peak of 33% in 2016 to just 12% in 2020.
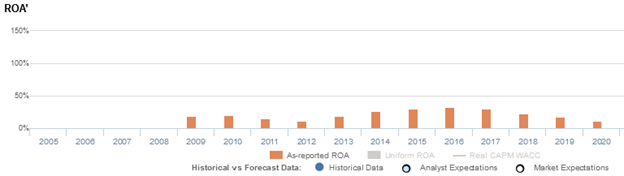
In reality, Uniform Accounting shows that the company’s strategies continue to generate strong demand, with Uniform ROAs maintained around 70%-100% levels in the same timeframe.
The distortion between Uniform and as-reported ROAs comes from as-reported metrics failing to consider the amount of goodwill on Pandora’s balance sheet. In recent years, goodwill sits at about DKK 4 billion, making it the firm’s largest long-term asset, arising from the acquisition of its subsidiaries and other non-controlling interests.
Goodwill is an intangible asset that is purely accounting-based and unrepresentative of the company’s actual operating performance. When as-reported accounting includes this in a company’s balance sheet, it creates an artificially inflated asset base.
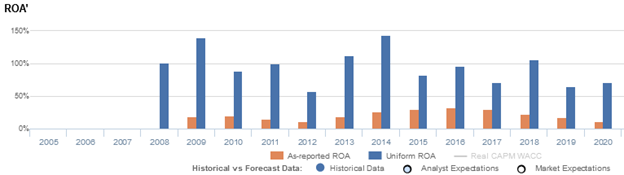
As a result, as-reported ROAs are not capturing the strength of Pandora’s earning power. Adjusting for goodwill, we can see that the company isn’t actually performing poorly. In fact, it has been the opposite, with returns that are up to 7x greater.
Pandora’s earning power is actually more robust than you think it is
As-reported metrics distort the market’s perception of the firm’s recent profitability. If you were to just look at as-reported ROA, you would think the company is a much weaker business than real economic metrics highlight.
Pandora’s Uniform ROA has actually been higher than its as-reported ROA in the past twelve years. For example, Uniform ROA was at 71% in 2020, while as-reported ROA was only at 12%.
Specifically, Pandora’s Uniform ROA has ranged from 57%-144% in the past twelve years while as-reported ROA ranged from only 11%-33% in the same timeframe.
Uniform ROA fell from 140% in 2009 to a low of 57% in 2012, before rebounding to a peak of 144% in 2014. Then, Uniform ROA dropped to 72% in 2017, before expanding to 106% in 2018 and falling back to 71% in 2020.
Pandora’s Uniform earnings margin is weaker than you think, but its Uniform asset turns make up for it
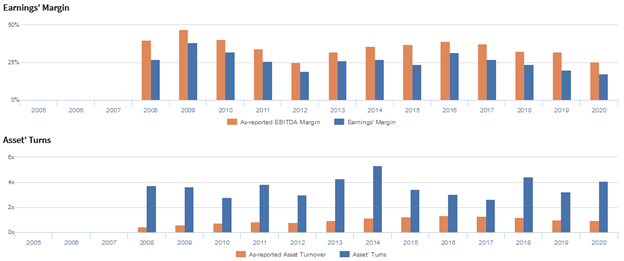
Trends in Uniform ROA have been driven by trends in Uniform asset turns and to a lesser extent, Uniform earnings margin.
After improving from 27% in 2008 to 38% in 2009, Uniform margins compressed to 19% in 2012. Then, Uniform margins recovered to 32% in 2016, before gradually falling to 17% in 2020.
Meanwhile, Uniform turns faded from 3.7x levels in 2008-2009 to 2.8x in 2010, before reaching a peak of 5.3x in 2014 and falling to 2.6x in 2017. Then, Uniform turns expanded to 4.4x in 2018, before dropping to 3.2x in 2019 and recovering to 4.1x in 2020.
At current valuations, the market is pricing in expectations for continued declines in Uniform margins and a reversal of recent improvement in Uniform turns.
SUMMARY and Pandora A/S Tearsheet
As the Uniform Accounting tearsheet for Pandora A/S (PNDORA:DNK) highlights, the Uniform P/E trades at 17.4x, which is below the global corporate average of 23.7x but above its historical Uniform P/E of 13.2x.
Low P/Es require low EPS growth to sustain them. In the case of Pandora, the company has recently shown a 26% Uniform EPS shrinkage.
Sell-side analysts provide stock and valuation recommendations that provide very poor guidance or insight in general. However, sell-side analysts’ near-term earnings forecasts tend to have relevant information.
We take sell-side forecasts for IFRS earnings and convert them to Uniform earnings forecasts. When we do this, Pandora’s sell-side analyst-driven forecast is a 30% and 12% EPS growth in 2021 and 2022, respectively.
Based on current stock market valuations, we can use earnings growth valuation metrics to back into the required growth rate to justify Pandora’s DKK 702 stock price. These are often referred to as market embedded expectations.
The company is currently being valued as if Uniform earnings were to shrink by 5% annually over the next three years. What sell-side analysts expect for Pandora’s earnings growth is above what the current stock market valuation requires through 2022.
Furthermore, the company’s earning power is 12x the corporate average. Also, cash flows and cash on hand are 1.5x higher than its total obligations—including debt maturities, capex maintenance, and dividends. Together, this signals a moderate dividend and credit risk.
To conclude, Pandora’s Uniform earnings growth is above its peer averages. However, the company is trading below its average peer valuations.
About the Philippine Market Daily
“Thursday Uniform Earnings Tearsheets – Global Focus”
Some of the world’s greatest investors learned from the Father of Value Investing or have learned to follow his investment philosophy very closely. That pioneer of value investing is Professor Benjamin Graham. His followers:
Warren Buffett and Charles Munger of Berkshire Hathaway; Shelby C. Davis of Davis Funds; Marty Whitman of Third Avenue Value Fund; Jean-Marie Eveillard of First Eagle; Mitch Julis of Canyon Capital; just to name a few.
Each of these great investors studied security analysis and valuation, applying this methodology to manage their multi-billion dollar portfolios. They did this without relying on as-reported numbers.
Uniform Adjusted Financial Reporting Standards (UAFRS or Uniform Accounting) is an answer to the many inconsistencies present in GAAP and IFRS, as well as in PFRS.
Under UAFRS, each company’s financial statements are rebuilt under a consistent set of rules, resulting in an apples-to-apples comparison. Resulting UAFRS-based earnings, assets, debts, cash flows from operations, investing, and financing, and other key elements become the basis for more reliable financial statement analysis.
Every Thursday, we focus on one multinational company that’s particularly interesting from a UAFRS vs as-reported standpoint. We highlight one adjustment that illustrates why the as-reported numbers are unreliable.
This way, we gain a better understanding of the factors driving a particular stock’s returns, and whether or not the firm’s true profitability is reflected in its current valuations.
Hope you’ve found this week’s Uniform earnings tearsheet on a multinational company interesting and insightful.
Stay tuned for next week’s multinational company highlight!
Regards,
Angelica Lim
Research Director
Philippine Markets Daily
Powered by Valens Research
www.valens-research.com


