
Uniform metrics reveal the TRUE beauty of this skincare company, whose actual earning power is above cost of capital at 9%!

With too much time on their hands due to the quarantine, many have turned to vlogging about all kinds of things to pass the time. Influencers aren’t the only ones posting vlogs on their 10-step skincare routine nowadays.
This beauty and cosmetics conglomerate operates more than 30 health, beauty, and personal care brands that you may be very familiar with. Additionally, this company’s TRUE earning power is far from what as-reported metrics are reporting.
Also below, Uniform Accounting Embedded Expectations Analysis and the Uniform Accounting Performance and Valuation Tearsheet for the company.
Philippine Markets Daily:
Wednesday Uniform Earnings Tearsheets – Asia-listed Focus
Powered by Valens Research
We previously discussed how “hallyu” influenced the global entertainment industry through their world-class movies, TV series, and pop music. However, the impact of Korean pop culture has gone beyond just that.
Since people have become very invested in Korean entertainment, most have familiarized themselves with their Korean idols’ lifestyles and beauty secrets. This paved the way for Korean culture to penetrate the beauty industry.
In recent years, Korean beauty (K-beauty) has revolutionized the beauty industry. Before the 2000s, Western companies dominated the industry with major brands coming from the United States and France.
While Western beauty gives focus to glamorous and grown-up looks, K-beauty has altered the perception of beauty standards towards having healthier skin and more natural looks. K-beauty emphasizes wellness, which has given rise to “cleaner” lifestyles and trends such as the “no make-up make-up look.”
As a result, skincare has become an increasingly lucrative business, becoming the strongest performer and largest contributor in the beauty industry growth in the past few years. This has made South Korea the current number one manufacturing hub for beauty products in the world.
Today, one of the world’s largest cosmetics companies is Amorepacific Group. It is considered as South Korea’s largest beauty and health company, dominating about half the market in the country.
Amorepacific has a wide range of brands under its portfolio, including global champion brands Laneige, Sulwhasoo, Mamonde, Innisfree, and Etude House.
Amorepacific has achieved major milestones by being the first Korean company to join the 1 trillion won sales club and rank in Women’s Wear Daily (WWD)’s list of Top 100 beauty companies.
Amorepacific’s philosophy is centered on “sharing the legacy of Asian Beauty with the world.” Keeping that in mind, the company merged Asian wisdom or traditional knowledge of nature with advanced technology and innovation. Amorepacific’s luxury brand, Sulwhasoo, created a new category in the industry with its launch of herbal cosmetics in 1997.
Throughout its history, Amorepacific has heavily invested in research and development, becoming the first company in Korea to establish a cosmetics research lab in 1954. This allowed the company to create industry-leading beauty solutions and innovative products.
For example, Amorepacific pioneered the first cushion compact in 2008. This became one of the best-selling products in the Korean cosmetics market by 2014, surpassing 200 billion KRW in sales.
With K-beauty leading the global skincare industry, there has been a proliferation of K-beauty start-ups and cosmetics companies which has increased competition in this fast-growing industry.
As a result, Amorepacific’s operating profit has dropped over the past three years, plunging by 9% in 2019, due to factors such as weak performance of budget brands, increased marketing expenses, and investments in new markets and channels.
On the other hand, sales of the company have increased by 3% in 2019, largely due to the aforementioned investments in global markets and rise in sales from the North American and Asian markets. Moreover, sales were also driven by the growth in duty-free business and domestic sales.
During Amorepacific’s 2020 kickoff meeting in January, CEO Seo Kyung-bae announced the exciting changes of the company for the year. He mentioned that Amorepacific will boost its brand competitiveness by continuously developing and supplying innovative products that will be launched to further build their unique brand status.
Amorepacific also plans to implement an Omni Digital Loop that provides its consumers with a platform “that engages in the customers’ shopping experience.” With this, the company aims to keep up with technological advancements adopted by millennials and Gen Z, to provide them with an “on the go” personalized experience.
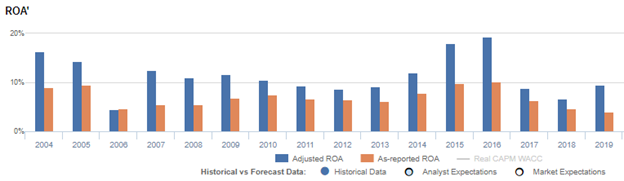
Despite the company’s strong brand worldwide presence and robust sales for the year, as-reported returns in 2019 was only at 4%, weaker than what it actually is.
Amorepacific’s real economic profitability can be better reflected with Uniform Accounting adjustments to show its TRUE earning power.
Looking at the company’s performance in 2016, Amorepacific’s Uniform ROA peaked at 19%, which is almost double its as-reported ROA of 10%. This shows that the company’s earning power has been distorted by the inconsistencies in accounting standards.
Amorepacific has regular material investments in research and development that as-reported metrics record as an outright expense. Because of this, as-reported metrics fail to follow the accounting principle that expenses should be recognized in the period when the related revenue is incurred. This distorts the company’s earning power.
R&D investment is actually an investment in the long-term cash flow generation of the company. If this remains treated as an expense, the company’s profitability may appear substantially weaker than it actually is.
After R&D and other significant adjustments are made, the company’s Uniform ROA is at 9% in 2019, which is 2x stronger than their as-reported ROA of 4%.
Amorepacific’s valuations is in line with the market
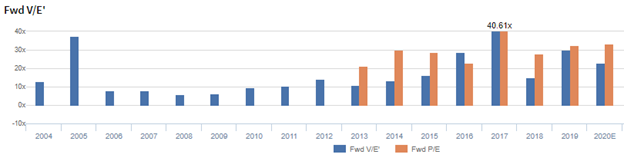
Amorepacific Group (002790:KOR) currently trades in line with corporate averages at a 23.1x Uniform P/E (blue bars), and is cheaper than the as-reported P/E of 33.4x (orange bars).
At these levels, the market is pricing in expectations for Uniform ROA to fall to 6% in 2024, accompanied by 3% Uniform asset growth going forward.
However, analysts have less bearish expectations, projecting Uniform ROA to only slightly decrease to 8% in 2021, accompanied by a 5% Uniform asset contraction.
Amorepacific Group’s profitability is much better than you think it is
As-reported metrics are distorting the market’s perception of the firm’s profitability.
If you were to just look at as-reported ROA, you would think that the company is a weaker business than real economic metrics highlight.
Amorepacific’s Uniform ROA has actually been higher than its as-reported ROA in the past thirteen years. For example, as-reported ROA was 4% in 2019, significantly lower than its Uniform ROA of 9%. When Uniform ROA peaked at 19% in 2016, as-reported ROA was just at 10%.
Through Uniform Accounting, we can see that the company’s true ROAs have actually been higher. Amorepacific’s Uniform ROA for the past eleven years has ranged from 7% to 19%, while as-reported ROA ranged only from 4% to 10% in the same timeframe.
After falling from 16% in 2004 to a historical low of 4% in 2006, Uniform ROA increased to 12% in 2007. Afterwards, Uniform ROA gradually declined to 8% in 2012 before peaking at 19% in 2016. Uniform ROA then plummeted to 7% in 2018 before recovering to 9% in 2019.
Amorepacific’s margins are weaker than you think, but its consistently stronger asset turnover makes up for it
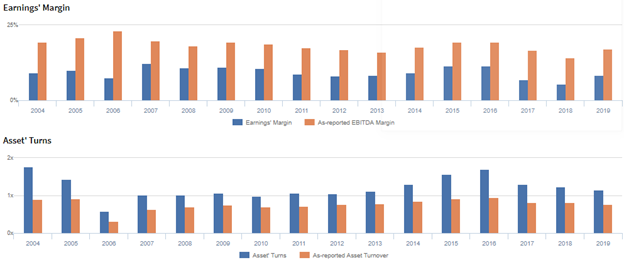
Cyclicality in Uniform ROA has been primarily driven by both trends in Uniform asset turns and Uniform earnings margins, with peaks and troughs lining up historically with that of Uniform ROA.
Uniform earnings margins fell from 9% in 2004 to 8% levels in 2006, before recovering to 12% in 2007. It then gradually fell to 8% in 2012, then surged to 11% in 2016 before falling to 5% in 2018. Uniform earnings margins recovered to 8% in 2019.
Meanwhile, Uniform asset turns fell from 1.8x in 2004 to 0.6x in 2006 before trending at 1.0x to 1.1x levels in 2007 to 2012. It then surged to 1.7x in 2016 before falling to 1.1x in 2019.
Summary and Amorepacific Group Tearsheet
As the Uniform Accounting tearsheet for Amorepacific highlights, they are trading at a 23.1x Uniform P/E, which is around average market valuations but below its historical P/E of 27.1x.
Low P/Es require low EPS growth to sustain them. In the case of Amorepacific, the company has recently shown a 295% Uniform EPS growth.
Sell-side analysts provide stock and valuation recommendations that in general provide very poor guidance or insight. However, sell-side analysts’ near-term earnings forecasts tend to have relevant information.
We take sell-side forecasts for Korean International Financial Reporting Standards (K-IFRS) earnings and convert them to Uniform earnings forecasts. When we do this, Amorepacific’s sell-side analyst-driven forecast is for Uniform earnings to decline by 60% in 2020 and increase by 85% in 2021.
Based on current stock market valuations, we can back into the required earnings growth rate that would justify KRW 57,700 per share. These are often referred to as market embedded expectations.
In order to meet the current market valuation levels of Amorepacific, the company would have to have Uniform earnings shrink by 6% each year over the next three years. What sell-side analysts expect for Amorepacific’s earnings growth is above what the current stock market valuation requires.
The company’s earning power, based on its Uniform return on assets calculation, is almost 2x corporate average returns. Furthermore, with cash flows and cash on hand consistently exceeding obligations, Amorepacific has low credit and dividend risk.
To conclude, Amorepacific’s Uniform earnings growth is below its peer averages in 2019 and it is also trading in line with peer average valuations.
About the Philippine Market Daily
“Wednesday Uniform Earnings Tearsheets – Asia-listed Focus”
Some of the world’s greatest investors learned from the Father of Value Investing or have learned to follow his investment philosophy very closely. That pioneer of value investing is Professor Benjamin Graham. His followers:
Warren Buffett and Charles Munger of Berkshire Hathaway; Shelby C. Davis of Davis Funds; Marty Whitman of Third Avenue Value Fund; Jean-Marie Eveillard of First Eagle; Mitch Julis of Canyon Capital; just to name a few.
Each of these great investors studied security analysis and valuation, applying this methodology to manage their multi-billion dollar portfolios. They did this without relying on as-reported numbers.
Uniform Adjusted Financial Reporting Standards (UAFRS or Uniform Accounting) is an answer to the many inconsistencies present in GAAP and IFRS, as well as in PFRS.
Under UAFRS, each company’s financial statements are rebuilt under a consistent set of rules, resulting in an apples-to-apples comparison. Resulting UAFRS-based earnings, assets, debts, cash flows from operations, investing, and financing, and other key elements become the basis for more reliable financial statement analysis.
Every Wednesday, we focus on one company listed in Asia that’s relevant to the Philippines and that’s particularly interesting from a UAFRS vs as-reported standpoint. We highlight one adjustment that illustrates why the as-reported numbers are unreliable.
This way, we gain a better understanding of the factors driving a particular stock’s returns, and whether or not the firm’s true profitability is reflected in its current valuations.
Hope you’ve found this week’s Uniform Earning Tearsheet on an Asian company interesting and insightful.
Stay tuned for next week’s Asia company highlight!
Regards,
Angelica Lim
Research Director
Philippine Markets Daily
Powered by Valens Research
www.valens-research.com