
Uniform ROAs accurately reflect this equipment company’s market leadership, and show why it’s always a winner during infrastructure booms

Whenever there are large amounts of cash flowing into infrastructure spending, one of the big winners is always this construction equipment manufacturing company, thanks to its market leadership.
The company set out to create a global footprint, building an expansive dealer network while consistently delivering top-of-the-line products that cemented its reputation as a quality construction equipment behemoth.
While as-reported metrics make it appear that this company is a weak, below cost of capital business, Uniform Accounting reveals the true value of its dominant industry position, with Uniform ROAs that are twice the as-reported numbers.
Also below, Uniform Accounting Embedded Expectations Analysis and the Uniform Accounting Performance and Valuation Tearsheet for the company.
Philippine Markets Daily:
Thursday Uniform Earnings Tearsheets – Global Focus
Powered by Valens Research
Using the expenditure approach, a country’s total gross domestic product (GDP) is broken down into four components: consumption, government spending, private investment, and net exports (i.e. exports less imports).
When GDP declines sharply, as is the case with recessions or depressions, the government can prop up economic growth by adopting an expansionary monetary policy or by lowering interest rates to stimulate borrowing, which will most likely increase consumption, private investment, and exports, and therefore GDP.
However, unlike the three other components, the government can actually influence growth in GDP, as well as labor and productivity, directly by increasing spending on public infrastructure, which makes it one of the most important tools used to kick-start a dwindling economy.
Under Franklin D. Roosevelt’s administration during the Great Depression, the U.S. government used infrastructure spending to spur economic growth, including the establishment of construction-centered organizations such as the Tennessee Valley Authority and Public Works Administration.
Even now, to revive growth lost because of the pandemic, President-elect Joe Biden plans to deploy a $2 trillion package aimed at building modern, sustainable infrastructure, among other green initiatives.
This proposal for new construction would lift demand for industries such as telecoms, utilities, and construction equipment. Owing to the surge in demand, Caterpillar, Inc. (CAT) comes out as a clear winner, as it always has been in times of massive capital investments.
Caterpillar is one of the leading construction equipment manufacturers in the world, and it’s a winner during infrastructure booms exactly for that reason.
In the late 1980s, at a time when the company was incurring losses, then-CEO Schaefer began investing to modernize its manufacturing plants. The goal was to beat Komatsu (6301:JPN), the leading construction equipment manufacturer at the time, by bringing modern solutions and efficient operations to the company—which it did.
Caterpillar amassed an extensive product portfolio with a focus on advanced technology, optimal product design, and robust quality, which is critical considering that many of the industries the company serves are highly sensitive to downtime.
Caterpillar has also gone global by organic expansion, as well as through the acquisition of companies across the globe to make it easier to integrate into the foreign market. Currently, the company has over 165 dealers, with about 157,000 employees employed in over 2,000 branches, that exclusively sells the company’s products.
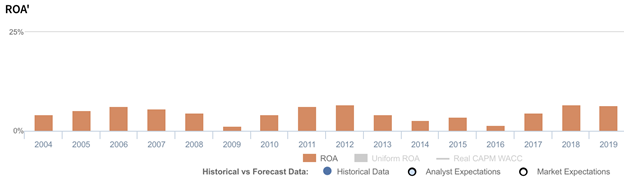
Despite the company’s best-in-class technology and extensive dealer network that allows its market leadership, Caterpillar has produced lackluster as-reported return on assets (ROAs).
Returns peaked at 6%, just barely above cost-of-capital levels, and has since been below those levels over the last 15 years.
In reality though, Uniform Accounting reflects a more accurate picture of the company’s leadership.
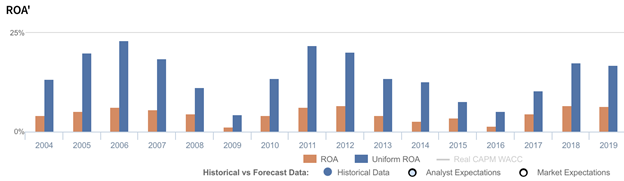
Caterpillar isn’t immune from the cyclicality of its end-markets, with ROAs falling during the Great Recession as well as during the oil glut that ran from 2014 to 2016. Still, Uniform ROAs have been over double the as-reported numbers for each of the past sixteen years, ranging from 4% to 23%.
The distortion between Uniform and as-reported ROAs comes from as-reported metrics failing to consider the amount of accumulated goodwill on Caterpillar’s balance sheet. In recent years, goodwill sits at about $6 billion, its third-largest long-term asset next to PP&E and long-term receivables, stemming from the company’s acquisitions to achieve a global footprint.
Goodwill is an intangible asset that is purely accounting-based and unrepresentative of the company’s actual operating performance. When as-reported accounting includes this in a company’s balance sheet, it creates an artificially inflated asset base.
As a result, as-reported ROAs are not capturing the strength of Caterpillar’s earning power. Adjusting for goodwill, returns are actually significantly greater.
Caterpillar’s earning power is actually more robust than you think
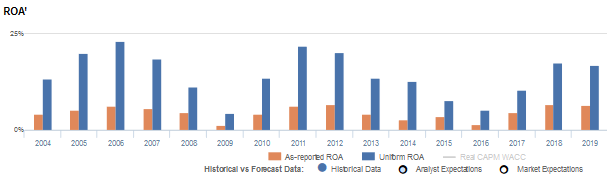
As-reported metrics distort the market’s perception of the firm’s recent profitability. If you were to just look at as-reported ROA, you would think that the company is a much weaker business than real economic metrics highlight.
Caterpillar’s Uniform ROA has actually been higher than its as-reported ROA in the past sixteen years. For example, as-reported ROA was 7% in 2019, but its Uniform ROA was actually 2x higher at 17%.
Specifically, Caterpillar’s Uniform ROA has ranged from 4% to 23% in the past sixteen years, while as-reported ROA has ranged only from 1% to 7% in the same time frame.
Uniform ROA reached cycle peaks of 23% in 2006, 22% in 2011, and 17% levels in 2018-2019, and cycle lows of 4% in 2009 and 5% in 2016.
Caterpillar’s Uniform earnings margins are weaker than you think, but its robust Uniform asset turns make up for it
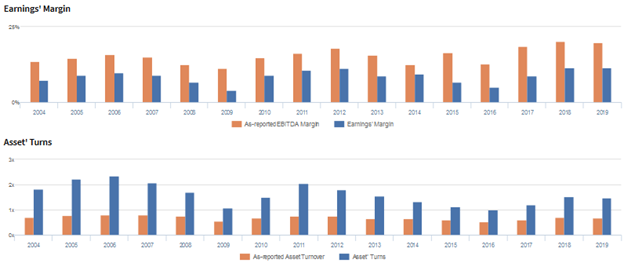
Cyclicality in Uniform ROA has been driven by compounding cyclicality in Uniform earnings margins and Uniform asset turns.
From 2004 to 2006, Uniform margins rose from 7% to 10% before falling to 4% in 2009. Then, after expanding to 11% peaks in 2011-2012, Uniform margins declined back to 5% in 2016 and subsequently rebounded to 12% in 2019.
Meanwhile, Uniform turns improved from 1.8x in 2004 to 2.4x in 2006 before contracting to 1.1x in 2009. Thereafter, Uniform turns recovered to 2.0x in 2011 and subsequently compressed to 1.0x in 2016, before rebounding to 1.5x levels in 2018-2019.
At current valuations, the market is pricing in expectations for continued improvement in both Uniform margins and Uniform turns.
SUMMARY and Caterpillar, Inc. Tearsheet
As the Uniform Accounting tearsheet for Caterpillar, Inc. (CAT) highlights, the Uniform P/E trades at 27.3x, which is above corporate average valuation levels and its own recent history.
High P/Es require high EPS growth to sustain them. In the case of Caterpillar, the company has recently shown a 4% Uniform EPS growth.
Wall Street analysts provide stock and valuation recommendations that provide very poor guidance or insight in general. However, Wall Street analysts’ near-term earnings forecasts tend to have relevant information.
We take Wall Street forecasts for GAAP earnings and convert them to Uniform earnings forecasts. When we do this, Caterpillar’s Wall Street analyst-driven forecast is a 52% EPS shrinkage in 2020 and a 45% EPS growth in 2021.
Based on current stock market valuations, we can use earnings growth valuation metrics to back into the required growth rate to justify Caterpillar’s $172 stock price. These are often referred to as market embedded expectations.
The company can have Uniform earnings shrink by 4% each year over the next three years and still justify current prices. What Wall Street analysts expect for Caterpillar’s earnings growth is below what the current stock market valuation requires in 2020, but above what it requires in 2021.
Furthermore, the company’s earning power is 3x the corporate average. However, cash flows and cash on hand are below its total obligations—including debt maturities and capex maintenance. Together, this signals a high risk to its credit.
To conclude, Caterpillar’s Uniform earnings growth is below its peer averages in 2020, but the company is trading well above its average peer valuations.
About the Philippine Market Daily
“Thursday Uniform Earnings Tearsheets – Global Focus”
Some of the world’s greatest investors learned from the Father of Value Investing or have learned to follow his investment philosophy very closely. That pioneer of value investing is Professor Benjamin Graham. His followers:
Warren Buffett and Charles Munger of Berkshire Hathaway; Shelby C. Davis of Davis Funds; Marty Whitman of Third Avenue Value Fund; Jean-Marie Eveillard of First Eagle; Mitch Julis of Canyon Capital; just to name a few.
Each of these great investors studied security analysis and valuation, applying this methodology to manage their multi-billion dollar portfolios. They did this without relying on as-reported numbers.
Uniform Adjusted Financial Reporting Standards (UAFRS or Uniform Accounting) is an answer to the many inconsistencies present in GAAP and IFRS, as well as in PFRS.
Under UAFRS, each company’s financial statements are rebuilt under a consistent set of rules, resulting in an apples-to-apples comparison. Resulting UAFRS-based earnings, assets, debts, cash flows from operations, investing, and financing, and other key elements become the basis for more reliable financial statement analysis.
Every Thursday, we focus on one multinational company that’s particularly interesting from a UAFRS vs as-reported standpoint. We highlight one adjustment that illustrates why the as-reported numbers are unreliable.
This way, we gain a better understanding of the factors driving a particular stock’s returns, and whether or not the firm’s true profitability is reflected in its current valuations.
Hope you’ve found this week’s Uniform earnings tearsheet on a multinational company interesting and insightful.
Stay tuned for next week’s multinational company highlight!
Regards,
Angelica Lim
Research Director
Philippine Markets Daily
Powered by Valens Research
www.valens-research.com


