
Wide economic moats allowed this tech giant to maintain dominance in the software space, commanding Uniform ROAs that are 3x higher than as-reported

A deal with another tech giant set this company’s path towards industry domination, with their legacy products capturing about 80%-90% of the operating systems and business productivity application markets.
The company has consistently innovated since then, leveraging its strong brand identity to capture share in other markets like the cloud space, and scaling massively to become a leader.
While as-reported metrics make it seem like the economic moats of the business are slowly losing its power, with ROAs falling below 10%, Uniform Accounting shows that these moats have sustained their strength and are instrumental in helping Uniform ROAs remain above 28% levels.
Also below, Uniform Accounting Embedded Expectations Analysis and the Uniform Accounting Performance and Valuation Tearsheet for the company.
Philippine Markets Daily:
Thursday Uniform Earnings Tearsheets – Global Focus
Powered by Valens Research
Bill Gates was the richest man in the world for much of the 2000s. It was only in recent years that he’s had to wrestle Jeff Bezos, founder of Amazon, for that title.
Much of Gates’ wealth was built around the establishment and management of a mega-successful business: Microsoft. One pivotal deal with another tech giant eventually secured the company a spot on the short list of trillion-dollar businesses.
In 1980, Microsoft signed a contract with IBM to build an operating system (OS) for IBM’s first personal computer. MS-DOS, as the OS was called, ran on every IBM computer. When the computer ultimately met market success, so did the OS.
Since the contract with IBM had a non-exclusivity clause, Microsoft could offer its OS to other computer manufacturers besides IBM. So when other companies started selling their own computers, IBM lost market share, but Microsoft, being the only OS at that time, continued to see its business expand.
The success of MS-DOS paved the way for what we now know as Windows. At this point, Windows already had the first versions of Microsoft Word and Microsoft Excel, which has now gained corporate popularity for its functionality.
Microsoft began to ramp up product development since then. The Windows operating system moved from versions 1.0 to Windows 95, 98, XP, and now 10. Word and Excel have also grown alongside the OS, with the two programs bundled with Powerpoint and sold under Microsoft Office.
Innovation has always been at the heart of their business, and Microsoft has made great strides on this front. They’re currently working on projects such as a hands-free keyboard that’s controlled using your eyes, and even holoportation, which allows you to send a holographic version of yourself to anywhere in the world in real time.
Although these innovations haven’t captured a sizable market share yet, the ones that have—the Windows OS, the Microsoft Office Suite, and relatively more recently, Microsoft Azure—proved to be highly profitable ventures for Microsoft.
Windows has dominated the operating software market, consistently capturing about 80%-90% of market share, while the remaining share is held by Macintosh, Google, and other smaller systems.
Its strong brand identity, user-familiarity, and the fact that it’s the default operating system for most non-Apple and non-Google computers, have all helped sustain its market share and become a stable revenue stream for Microsoft.
Microsoft Office, on the other hand, comes with every Windows-powered computer but can also be licensed to non-Windows users. Applications like Excel, Word, and Powerpoint have become the dominant corporate applications since their release, with many corporate settings today requiring at least a basic knowledge of these applications as a job requirement.
In recent years, Google’s cloud applications have been successful in taking market share away from Microsoft.
Even so, Microsoft Office’s more flexible pricing plans, constant feature improvements, and added cloud storage have solidified the moats of their legacy applications while keeping competition at bay.
Finally, Microsoft Azure, the company’s cloud business, has been equally profitable. Azure offers enterprise solutions in the fields of analytics, computing, storage, among others.
Although the cloud space is a highly competitive industry, with heavy-hitters such as Amazon, Google, and IBM competing, Microsoft has been able to maintain an advantage by leveraging its strong company brand, having massive scaling, and accelerating the buildup of critical features.
Combining these three innovations, plus the strength of these brands that Microsoft has fostered, created tremendously robust economic moats for the company.
However, these moats do not seem to be as strong, with as-reported ROAs never breaching 20%—except in 2008—and having recently fallen below 10% levels.
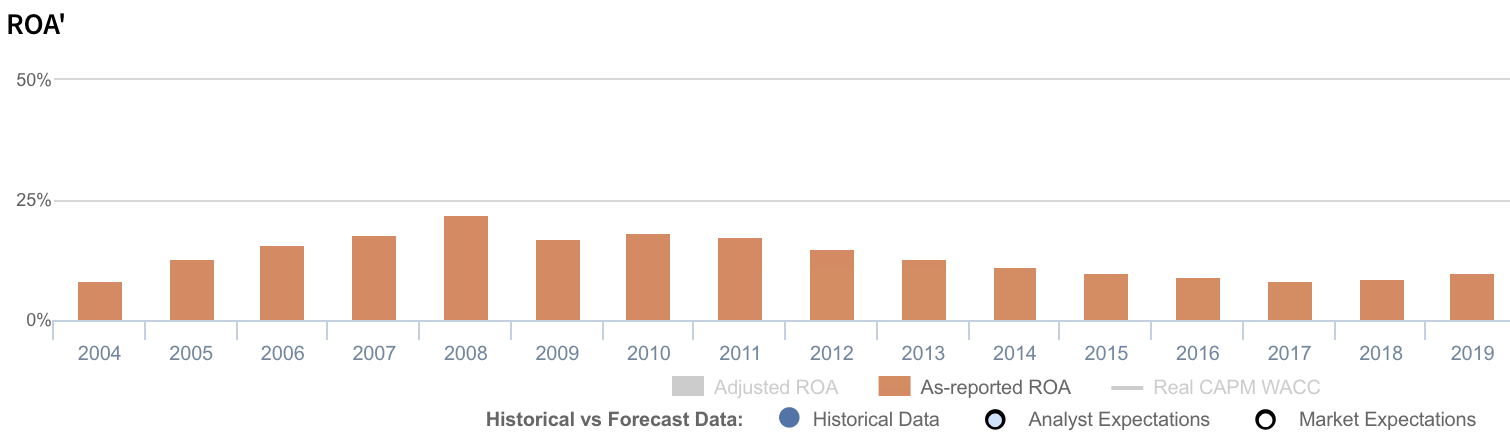
In reality, looking at Microsoft’s returns through the lens of Uniform Accounting shows that the company’s economic moats have helped its returns stay above 25%.

What as-reported metrics fail to do is to consider excess cash on the balance sheet. While most companies inherently need some level of cash to operate, the portion of that balance that is earning limited or no return—or excess cash—ends up diluting as-reported ROAs.
As in the case of Microsoft, about half of the company’s total assets or about $130 billion, have consistently been composed of cash and highly-liquid short-term investments.
Furthermore, goodwill places second in terms of highest asset value on Microsoft’s balance sheets. This comes from many of the company’s acquisitions to support its product offerings such as Skype for their Productivity and Business Processes segment and Github for their Cloud business, among others.
However, goodwill is an intangible asset that is purely accounting-based and unrepresentative of the company’s actual operating performance. When as-reported accounting includes this in a company’s balance sheet, it creates an artificially inflated asset base.
Together, the amount of excess cash and goodwill on the company’s balance sheets have been inflating its asset base and shrinking ROAs. Adjusting for both of these, we can see that Microsoft’s earning power is actually 3x as-reported, showing just how strong its economic moats are.
Microsoft’s earning power is actually more robust than you think
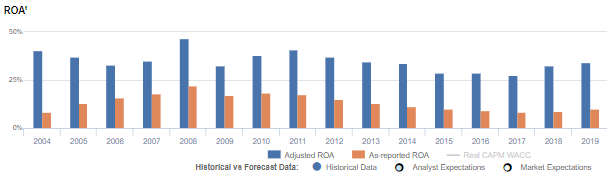
As-reported metrics distort the market’s perception of the firm’s recent profitability. If you were to just look at as-reported ROA, you would think that the company is a much weaker business than real economic metrics highlight.
Microsoft’s Uniform ROA has actually been higher than its as-reported ROA in the past sixteen years. For example, as-reported ROA was 10% in 2019, but its Uniform ROA was actually over 3x higher at 34%.
Through Uniform Accounting, we can see that the company’s true ROAs have actually been much higher. Microsoft’s Uniform ROA has ranged from 28% to 47% in the past sixteen years while as-reported ROA ranged only from 8% to 22% in the same timeframe.
After rising to a peak of 47% in 2008, Uniform ROA declined to 33% in 2009 before expanding to 41% in 2011. It then compressed to 28% in 2017 and subsequently rose to 34% in 2019.
Microsoft’s Uniform earnings margins are weaker than you think, but its robust Uniform asset turns make up for it
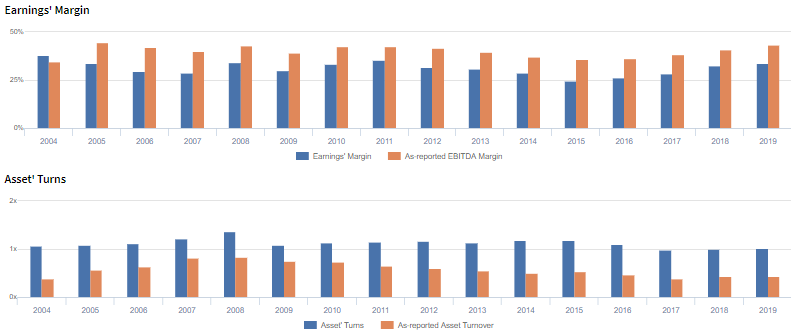
Microsoft’s volatile profitability has been driven by trends in Uniform earnings margins, slightly offset by trends in Uniform asset turns.
From 2004-2007, Uniform earnings margins gradually declined from a peak of 38% to 29%, before expanding back to 36% in 2011. It then compressed to a low of 24% in 2015, and rebounded to 34% in 2019.
Meanwhile, Uniform turns increased from 1.1x in 2004 to a peak of 1.4x in 2008, before compressing back to 1.1x in 2009. It then maintained 1.1x-1.2x levels through 2016, before declining to 1.0x levels in 2017-2019.
At current valuations, markets are pricing in an expectation for continued Uniform margins expansion and for Uniform turns to reverse recent declines.
SUMMARY and Microsoft Tearsheet
As the Uniform Accounting tearsheet for Microsoft, Inc. (MSFT) highlights, the Uniform P/E trades at 30.1x, which is above corporate average valuation levels and its own recent history.
High P/Es require high EPS growth to sustain them. In the case of Microsoft, the company has recently shown a 22% Uniform EPS contraction.
Wall Street analysts provide stock and valuation recommendations that in general provide very poor guidance or insight. However, Wall Street analysts’ near-term earnings forecasts tend to have relevant information.
We take Wall Street forecasts for GAAP earnings and convert them to Uniform earnings forecasts. When we do this, Microsoft’s Wall Street analyst-driven forecast is a 21% and 6% EPS growth in 2020 and 2021, respectively.
Based on current stock market valuations, we can use earnings growth valuation metrics to back into the required growth rate to justify Microsoft’s $206 stock price. These are often referred to as market embedded expectations.
The company needs Uniform earnings to grow 13% each year over the next three years to justify current prices. What Wall Street analysts expect for Microsoft’s earnings growth is above what the current stock market valuation requires in 2020, but below its requirement in 2021.
Furthermore, the company’s earning power is 6x the corporate average. Also, cash flows are 4x higher than its total obligations—including debt maturities, capex maintenance, and dividends. Together, this signals a low credit and dividend risk.
To conclude, Microsoft’s Uniform earnings growth is above its peer averages in 2020, but the company is trading in line with average peer valuations.
About the Philippine Markets Daily
“Thursday Uniform Earnings Tearsheets – Global Focus”
Some of the world’s greatest investors learned from the Father of Value Investing or have learned to follow his investment philosophy very closely. That pioneer of value investing is Professor Benjamin Graham. His followers:
Warren Buffett and Charles Munger of Berkshire Hathaway; Shelby C. Davis of Davis Funds; Marty Whitman of Third Avenue Value Fund; Jean-Marie Eveillard of First Eagle; Mitch Julis of Canyon Capital; just to name a few.
Each of these great investors studied security analysis and valuation, applying this methodology to manage their multi-billion dollar portfolios. They did this without relying on as-reported numbers.
Uniform Adjusted Financial Reporting Standards (UAFRS or Uniform Accounting) is an answer to the many inconsistencies present in GAAP and IFRS, as well as in PFRS.
Under UAFRS, each company’s financial statements are rebuilt under a consistent set of rules, resulting in an apples-to-apples comparison. Resulting UAFRS-based earnings, assets, debts, cash flows from operations, investing, and financing, and other key elements become the basis for more reliable financial statement analysis.
Every Thursday, we focus on one multinational company that’s particularly interesting from a UAFRS vs as-reported standpoint. We highlight one adjustment that illustrates why the as-reported numbers are unreliable.
This way, we gain a better understanding of the factors driving a particular stock’s returns, and whether or not the firm’s true profitability is reflected in its current valuations.
Hope you’ve found this week’s Uniform earnings tearsheet on a multinational company interesting and insightful.
Stay tuned for next week’s multinational company highlight!
Regards,
Angelica Lim
Research Director
Philippine Markets Daily
Powered by Valens Research
www.valens-research.com