
With a 14% Uniform ROA, this real estate giant has developed profitability that is 5x its as-reported returns!

Certain industries bore the brunt of the economic shutdown in the past three months. Real estate developers, in particular, have had to deal with no income from rent, as well as construction delays.
This real estate developer is China’s second largest in terms of sales. It joined the battle against the novel coronavirus by donating shares worth CNY 5.3 billion to one of Tsinghua University’s funds in order to establish a public health research institute.
As-reported metrics show that this business is barely earning above the cost of capital. Uniform metrics show that its TRUE earning power is actually much higher.
That said, there’s still ONE major issue that investors might not be aware of. Valens Research President and CEO Joel Litman discusses this in his latest Forbes article on the next big bath.
Also below, Uniform Accounting Embedded Expectations Analysis and the Uniform Accounting Performance and Valuation Tearsheet for the company.
Philippine Markets Daily:
Wednesday Uniform Earnings Tearsheets – Asia-listed Focus
Powered by Valens Research
Lockdowns or quarantines for most countries started in late March, but Q1 earnings results so far show most companies already reporting losses for the quarter. If temporary business closures only started toward the beginning of the second quarter, it’s almost certain that Q2 results will be far worse.
China’s lockdowns started in late January and ended early April, and a lot of Chinese companies have reported brutal Q1 2020 earnings.
A few months after China’s lockdown ended, analysts have become optimistic about China’s economic recovery. Some are optimistic that the market may recover in Q2, hoping that the worst has already passed.
However, a “Big Bath” scenario is more likely to come this quarter.
The “Big Bath” is when a collapse in actual cash earnings is compounded by a financial reporting anomaly. The last time this happened across the board was in the Great Recession of 2008. Companies in the US took over $200 billion in non-operating unusual items charges in Q4 2008.
Management teams are allowed to do this under US GAAP. They are even required to examine their businesses each year to check for potential writedowns and restructuring.
Taking those one-off items in an already bad quarter or year gives management teams the opportunity to show better results in the future.
The big bath practice isn’t just for US companies though—it can happen anywhere.
Let’s take a look at this real estate development and property management company in China.
The real estate industry was severely hit during the 2007-08 financial crisis. During those times, China experienced a slowdown in construction, falling property prices, and growing numbers of unoccupied buildings.
Even a big company like China Vanke, one of the biggest real estate companies in the country, was not immune to the effects of the global financial crisis.
In 2008, China Vanke reported a 16.7% decline in its profits caused by the decline in housing demand.
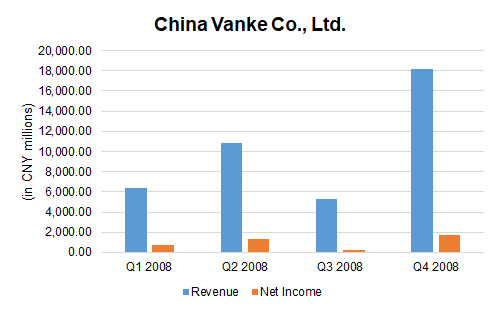
Based on the results above, it would appear that China Vanke’s net income took its largest hit in Q3 2008 because of much lower revenues. However, if we take a closer look at their financial statements, we will find a curious thing.
In the same period, the company reported a material asset writedown of more than CNY 500 million, which was much larger than any of the writedowns they have had in the past. Since asset writedown is treated as an expense in the income statement, China Vanke’s net income would naturally be much lower than if they had not taken the asset writedown.
However, in Q4 2008, the company reverted this asset writedown, contributing to its better performance compared to Q3 2008. The reversion of the asset writedown partially offset the company’s higher expenses during the quarter, making their earnings look higher.
In this strategy, the company made their earnings in Q3 2008 worse than it should be, making their Q4 2008 earnings look better than it actually was.
Now, China Vanke seems to be in the same position as it was during the 2008 financial crisis.
In Q1 2020, the company posted a net profit growth of 11.5% Y/Y, despite reporting a 1.2% decrease in revenue and decline in property sales.
Analysts might believe that this is a sign of good recovery, but with most of the lockdown having occurred in Q2 2020, it’s more likely that China Vanke will report worse earnings for Q2 2020.
It is also likely that they have saved this “Big Bath” for the second quarter.
China’s real estate market has been heavily affected by the pandemic due to business closures, with the retail and hospitality sectors receiving the largest hit. Commercial real estate transactions plummeted nearly 70% from January-February year-on-year.
Nonetheless, Oxford Economics still predicts a robust recovery for the remaining quarters of 2020, as China slowly recovers and new trends and growth opportunities emerge from the pandemic. According to Jones Lang LaSalle (JLL) Incorporated, investors are still showing interest in China’s real estate market.
The need for better and safer living conditions will change the landscape of the real estate industry. Moreover, tenants are also seeking better payment schemes and leniency from their landlords, similar to the treatment that homeowners received during the pandemic.
On the other hand, developers and sales agents will need more pricing information in order to make smooth transactions while simultaneously providing better property management to their consumers.
Big bath potential aside, as-reported metrics still don’t paint the full picture of China Vanke’s real operating profitability.
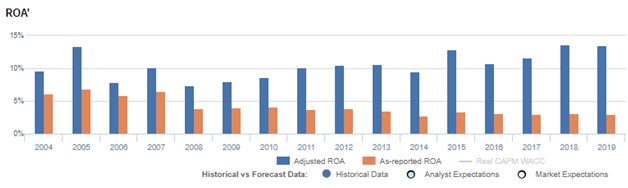
The company’s real economic profitability can be better reflected with Uniform Accounting adjustments. Looking at the company’s performance in 2019, China Vanke’s Uniform ROA is at 14%, which is almost 5x its as-reported ROA of 3%.
One key metric that is causing distortions in as-reported ROAs is minority interest expense.
Minority interest expense is the portion of the company’s total earnings that is attributed to its minority shareholders. These minority shareholders are investors or other organizations that own less than 50% of the company.
China Vanke regularly reports minority interest expense, which is deducted from the company’s total earnings. This is done to account for the part of the earnings that is allocated to the company’s minority shareholders.
However, removing minority interest expense from a company’s net income does not show its performance as a whole, making the company’s profitability appear substantially weaker than it actually is. By adding it back to the company’s net income, we can see the company’s true earning power as a whole and not just a part of it.
After minority interest expense and other significant adjustments are made, the company’s Uniform ROA is at 14% in 2019, not just the as-reported ROA of 3%.
China Vanke’s valuations are cheaper than corporate averages
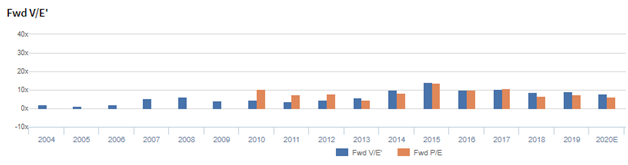
China Vanke Co., Ltd. (000002:CHN) currently trades below corporate averages at a 7.8x Uniform P/E (blue bars), which is in line with its as-reported P/E of 6.4x (orange bars).
At these levels, the market is pricing in expectations for Uniform ROA to fall to 4% in 2024, accompanied by 14% Uniform asset growth going forward.
However, analysts have more bullish expectations, projecting Uniform ROA to increase to 15% in 2021, accompanied by a 12% Uniform asset growth.
China Vanke’s profitability is much better than you think it is
As-reported metrics are distorting the market’s perception of the firm’s profitability.
If you were to just look at as-reported ROA, you would think that the company is a weaker business than real economic metrics highlight.
China Vanke’s Uniform ROA has actually been higher than its as-reported ROA in the past sixteen years. For example, as-reported ROA is 3% in 2019, significantly lower than its Uniform ROA of 14%. When Uniform ROA reached 13% in 2015, as-reported ROA was just at 3%.
Through Uniform Accounting, we can see that the company’s true ROAs have actually been higher. China Vanke’s Uniform ROA for the past sixteen years has ranged from 7% to 14%, while as-reported ROA ranged only from 3% to 7% in the same timeframe.
From 10% in 2004, Uniform ROA increased to 13% in 2005 before falling to its all-time low of 7% in 2008. Afterwards, Uniform ROA gradually recovered to 13% in 2015, before falling back to 11% in 2016 and then recovering to 14% in 2019.
China Vanke’s margins may be weaker than you think, but its stronger turns make up for it
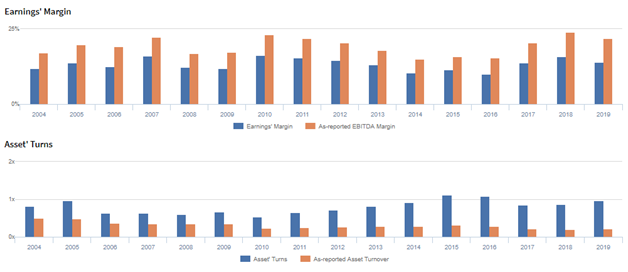
Cyclicality in Uniform ROA has been primarily driven by both trends in Uniform asset turns and Uniform earnings margins, with peaks and troughs lining up historically with that of Uniform ROA.
Uniform earnings margins increased from 12% in 2004 to 16% in 2007, before falling to 12% in 2008. It then recovered to 16% in 2010, before gradually declining to 10% in 2016. Afterwards, Uniform earnings margins reached 14% in 2019.
Meanwhile, Uniform asset turns increased from 0.8x in 2004 to 1.0x in 2005 before trending at 0.5x to 0.7x levels in 2006 to 2012. It then peaked at 1.1x in 2015 before falling to 1.0x in 2019.
SUMMARY and China Vanke Co., Ltd. Tearsheet
As the Uniform Accounting tearsheet for China Vanke Co., Ltd. (000002:CHN) highlights, the Uniform P/E trades at 7.8x, which is far below corporate average valuation levels but around its own recent history.
Low P/Es require low EPS growth to sustain them. In the case of China Vanke, the company has recently shown a 10% Uniform EPS growth.
Sell-side analysts provide stock and valuation recommendations that in general provide very poor guidance or insight. However, sell-side analysts’ near-term earnings forecasts tend to have relevant information.
We take sell-side forecasts for Chinese Accounting Standards (CAS) earnings and convert them to Uniform earnings forecasts. When we do this, China Vanke’s sell-side analyst-driven forecast is a 29% and 19% growth in 2020 and 2021, respectively.
Based on current stock market valuations, we can use earnings growth valuation metrics to back into the required growth rate to justify China Vanke’s CNY 26.41 stock price. These are often referred to as market embedded expectations.
The company can have Uniform earnings shrink by 14% each year over the next three years and still justify current price levels. What sell-side analysts expect for China Vanke’s earnings growth is above what the current stock market valuation requires.
The company’s earning power is 2x the corporate average. However, cash flows are below its total obligations—including debt maturities, capex maintenance, and dividends. Together, this signals exposure to credit and dividend risk.
To conclude, China Vanke’s Uniform earnings growth is below its peer averages in 2020. Additionally, the company is trading below average peer valuations.
About the Philippine Market Daily
“Wednesday Uniform Earnings Tearsheets – Asia-listed Focus”
Some of the world’s greatest investors learned from the Father of Value Investing or have learned to follow his investment philosophy very closely. That pioneer of value investing is Professor Benjamin Graham. His followers:
Warren Buffett and Charles Munger of Berkshire Hathaway; Shelby C. Davis of Davis Funds; Marty Whitman of Third Avenue Value Fund; Jean-Marie Eveillard of First Eagle; Mitch Julis of Canyon Capital; just to name a few.
Each of these great investors studied security analysis and valuation, applying this methodology to manage their multi-billion dollar portfolios. They did this without relying on as-reported numbers.
Uniform Adjusted Financial Reporting Standards (UAFRS or Uniform Accounting) is an answer to the many inconsistencies present in GAAP and IFRS, as well as in PFRS.
Under UAFRS, each company’s financial statements are rebuilt under a consistent set of rules, resulting in an apples-to-apples comparison. Resulting UAFRS-based earnings, assets, debts, cash flows from operations, investing, and financing, and other key elements become the basis for more reliable financial statement analysis.
Every Wednesday, we focus on one company listed in Asia that’s relevant to the Philippines and that’s particularly interesting from a UAFRS vs as-reported standpoint. We highlight one adjustment that illustrates why the as-reported numbers are unreliable.
This way, we gain a better understanding of the factors driving a particular stock’s returns, and whether or not the firm’s true profitability is reflected in its current valuations.
Hope you’ve found this week’s Uniform Earning Tearsheet on an Asian company interesting and insightful.
Stay tuned for next week’s Asia company highlight!
Regards,
Angelica Lim
Research Director
Philippine Markets Daily
Powered by Valens Research
www.valens-research.com