
Almost every smartphone in the market is equipped with this company’s chips, and Uniform Accounting reveals its industry-leading returns of 20%+

The semiconductor industry is notorious for its cyclicality. Chips have generally short lifespans—advancements in chip technology progress quickly, replacing the older, less advanced versions. This creates periods of high demand for the newer tech followed by an oversupply in the older, less advanced products.
This semiconductor company, however, managed to bypass the industry’s cyclicality by manufacturing the chips AND licensing the use thereof. That way, it was able to stabilize its profits from the steady stream of royalty fees received from their end-clients.
While as-reported metrics make it appear that the company’s licensing model has only produced industry-average returns, Uniform Accounting reveals the additional revenues from patent royalties have in fact led to ROAs as high as 40%.
Also below, Uniform Accounting Embedded Expectations Analysis and the Uniform Accounting Performance and Valuation Tearsheet for the company.
Philippine Markets Daily:
Thursday Uniform Earnings Tearsheets – Global Focus
Powered by Valens Research
A company is described to have monopoly control if it has significant dominance over an industry or a market. The company has characteristics such as high barriers to entry, the ability to dictate prices, and significant economies of scale.
Pure monopolies, however, are rare considering governments have established stringent antitrust laws to prevent one company from having total control of a market. Still, there are companies who exercise a significant enough control to be labeled as near-monopolies.
Google is a good example of this type of competition, with the company enjoying over 80% of the search engine market share, leaving the rest for Yahoo, Bing, and other smaller competitors.
Similarly, Qualcomm (QCOM) has a near-monopoly over the mobile processors market—every Android and Apple smartphone in the market right now uses a Qualcomm chip.
The company’s initial business was focused on code division multiple access (CDMA) technologies, which basically allows for calls and the internet to be transmitted in one radio signal. Specifically, following the adoption of US-based cellular networks of the CDMA standard, the company was mainly a manufacturer of CDMA-based phones.
However, because this division was massively unprofitable, Qualcomm decided to restructure by spinning off its phone manufacturing business and concentrating instead on its higher-margin chipset business.
Qualcomm entered into several joint ventures and company acquisitions with both US and international companies. With this, the company was able to stabilize a strong and consistent presence in the global semiconductor market.
Furthermore, what really cemented the company’s position as a top player in the industry is its introduction of Snapdragon, the chip the majority of smartphones use. What sets it apart from other chips is it includes a system that integrates all components of the mobile phone.
Specifically, it includes a CPU, a graphics processing unit (GPU), GPS, and an AI engine. These components allow for power-efficient and ultrafast network connectivity, advanced photo and video capabilities, virtual and augmented reality features, AI personal assistants, and recently, 5G connectivity.
Even with the company’s best-in-class products, however, it is still operating in the semiconductor industry, which is known for its boom and bust cycles—technological advancements cause a spike in demand for the newer tech, overridden by an oversupply in the older, less advanced products.
Although, rather than tying its entire business model to chip manufacturing, which bears the brunt of the industry’s cyclicality, Qualcomm also licenses the use of its technology as well.
Not only do smartphone companies pay for the company’s chips, they are also required to sign a license agreement that obligates them to pay a specified percentage of a phone’s total value as royalty.
This way, Qualcomm is able to stabilize its profits because smartphone retailers generally do not have to deal with heavy fluctuations in demand the way pure semiconductor manufacturers do.
Plus, the company’s Snapdragon chips are the best in the market and have been used in almost every smartphone in the market. Switching to a different chip would entail a company would create a more innovative chip, which would be costly in terms of time and money, making Qualcomm’s licensing model even stickier.
However, as-reported metrics make it seem as though the company’s ingenious business model and industry-leading products have not translated into industry-leading returns. As-reported return on assets (ROA) have stayed below the company’s cost of capital until recently.
Uniform returns, on the other hand, paint a significantly different picture. Uniform ROAs have been more robust, consistently remaining north of 25% up until 2016. However, even with the decline due to Apple’s refusal to pay the royalty fees, returns are still at robust levels.

One source of the distortion between Uniform and as-reported ROAs comes from as-reported metrics incorrectly treating R&D as an expense.
R&D is an investment in the long-term cash flow generation of the company. By recording R&D as an expense, this violates one of the core principles of accounting, which is expenses should be recognized in the period when the related revenue is incurred.
Since as-reported accounting records R&D on the income statement instead of as an investment on the balance sheet, net income can become materially understated.
Qualcomm materially spends on R&D as it continues to make investments to improve its existing products and expand its portfolio. The company’s R&D spend has consistently been around $5 billion to $6 billion, which is around one-third of total operating costs, significantly distorting the company’s profitability.
After adjustments, we can see Qualcomm’s Uniform ROAs are actually significantly higher than as-reported ROAs. Without this adjustment, it appears the firm is having less success with its R&D investments than it really is, leading to poorer valuations.
Qualcomm’s earning power is actually more robust than you think

As-reported metrics distort the market’s perception of the firm’s recent profitability. If you were to just look at as-reported ROA, you would think the company is a much weaker business than real economic metrics highlight.
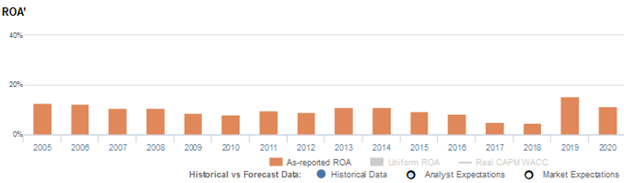
Qualcomm’s Uniform ROA has actually been higher than its as-reported ROA in fifteen of the past sixteen years. For example, as-reported ROA was 11% in 2014, but its Uniform ROA was actually almost 4x higher at 42%.
Specifically, Qualcomm’s Uniform ROA has ranged from 11% to 42% in the past sixteen years while as-reported ROA ranged only from 5% to 15% in the same time frame.
After declining from 38% in 2005 to 27% in 2010, excluding the 30% outperformance in 2009, Uniform ROA rebounded to a peak of 42% in 2014 before compressing to 14% in 2020.
Qualcomm Uniform earnings margins are generally weaker than you think, but its Uniform asset turns more than make up for it

Qualcomm’s overall declines in Uniform ROA have been driven largely by declining Uniform earnings margins and to a lesser extent, trends in Uniform asset turns.
Uniform margins sustained 27%-38% levels from 2005-2016, before fading to a low of 13% in 2019 and subsequently recovering to 19% in 2020.
Meanwhile, Uniform turns maintained 0.9x-1.1x levels from 2005-2011, before improving to 1.2x levels in 2012-2014. Thereafter, Uniform turns faded to 0.8x in 2017, before rebounding back to 0.9x-1.0x levels in 2018-2019. Since then, Uniform turns have compressed to 0.8x in 2020.
At current valuations, markets are pricing in expectations for continued recovery in both Uniform margins and Uniform turns.
SUMMARY and Qualcomm Tearsheet
As the Uniform Accounting tearsheet for QUALCOMM Incorporated (QCOM) highlights, its Uniform P/E trades at 26.6x, which is above corporate average valuation levels, but around its own recent history.
High P/Es require high EPS growth to sustain them. In the case of Qualcomm, the company has recently shown a 69% Uniform EPS growth.
Wall Street analysts provide stock and valuation recommendations that in general provide very poor guidance or insight. However, Wall Street analysts’ near-term earnings forecasts tend to have relevant information.
We take Wall Street forecasts for GAAP earnings and convert them to Uniform earnings forecasts. When we do this, Qualcomm’s Wall Street analyst-driven forecast is a 66% and an 8% EPS growth in 2021 and 2022, respectively.
Based on current stock market valuations, we can use earnings growth valuation metrics to back into the required growth rate to justify Qualcomm’s $158 stock price. These are often referred to as market embedded expectations.
The company needs Uniform earnings to grow 16% each year over the next three years to justify current prices. What Wall Street analysts expect for Qualcomm’s earnings growth is above what the current stock market valuation requires in 2021, but below its requirement in 2022.
Furthermore, the company’s earning power is 2x the corporate average. Furthermore, cash flows and cash on hand are 3x its total obligations—including debt maturities, capex maintenance, and dividends. Together, this signals a low credit and dividend risk.
To conclude, Qualcomm’s Uniform earnings growth is above its peer averages in 2021, and the company is trading slightly above its average peer valuations.
About the Philippine Market Daily
“Thursday Uniform Earnings Tearsheets – Global Focus”
Some of the world’s greatest investors learned from the Father of Value Investing or have learned to follow his investment philosophy very closely. That pioneer of value investing is Professor Benjamin Graham. His followers:
Warren Buffett and Charles Munger of Berkshire Hathaway; Shelby C. Davis of Davis Funds; Marty Whitman of Third Avenue Value Fund; Jean-Marie Eveillard of First Eagle; Mitch Julis of Canyon Capital; just to name a few.
Each of these great investors studied security analysis and valuation, applying this methodology to manage their multi-billion dollar portfolios. They did this without relying on as-reported numbers.
Uniform Adjusted Financial Reporting Standards (UAFRS or Uniform Accounting) is an answer to the many inconsistencies present in GAAP and IFRS, as well as in PFRS.
Under UAFRS, each company’s financial statements are rebuilt under a consistent set of rules, resulting in an apples-to-apples comparison. Resulting UAFRS-based earnings, assets, debts, cash flows from operations, investing, and financing, and other key elements become the basis for more reliable financial statement analysis.
Every Thursday, we focus on one multinational company that’s particularly interesting from a UAFRS vs as-reported standpoint. We highlight one adjustment that illustrates why the as-reported numbers are unreliable.
This way, we gain a better understanding of the factors driving a particular stock’s returns, and whether or not the firm’s true profitability is reflected in its current valuations.
Hope you’ve found this week’s Uniform earnings tearsheet on a multinational company interesting and insightful.
Stay tuned for next week’s multinational company highlight!
Regards,
Angelica Lim
Research Director
Philippine Markets Daily
Powered by Valens Research
www.valens-research.com


