
Building more campuses is causing this university’s returns to deteriorate, but at almost double as-reported ROAs, it deserves a passing grade

A company’s ROA (return on assets) trend can tell a lot about its capital efficiency. Improving ROAs are generally good, while declining ROAs are generally problematic.
However, this may not always be the case. This Philippine university’s ROA trend has been deteriorating over the years, but proper context suggests that this is not as troubling as it seems. Only Uniform Accounting shows that the company’s strategy is actually succeeding.
Also below, Uniform Accounting Embedded Expectations Analysis and the Uniform Accounting Performance and Valuation Tearsheet for the company.
Philippine Markets Daily:
Tuesday Uniform Earnings Tearsheets – Philippine-listed Focus
Powered by Valens Research
Much has been discussed about the impact of COVID-19 on the retail and aviation industries, as those are the most obviously affected by the quarantine restrictions. Another industry has suffered gravely because of the pandemic but isn’t as talked about—the education industry.
The suspension of face-to-face classes in March forced schools to either resort to online classes or to end the previous academic year prematurely.
As the suspension continues to take effect, the Department of Education (DepEd) had to delay the start of the Academic Year (AY) 2020-2021, to give time for public schools to advance their digital capabilities.
Nonetheless, student enrollment has gone down. DepEd estimates that nearly 4 million students remain unregistered for this academic year.
Meanwhile, for private colleges and universities, the pandemic adds to the challenges they had already been facing, specifically the passing of Republic Acts (RA) 10533 and 10931.
RA 10533 added senior high school to the basic education curriculum, disrupting the flow of incoming college students. As such, higher education enrollment declined during 2015-2018.
Although enrollment has been on a rebound, the numbers are still far from its historical peak and will likely see another dip due to the pandemic.
In addition, RA 10931 primarily grants free education in public colleges and universities, which raises the requirements of private colleges and universities to compete for and attract students.
Looking at the performance of the largest publicly traded Philippine university, we see how the mentioned headwinds have impacted the business and its industry. In 2018, The Far Eastern University, Incorporated (FEU:PHL) reached its lowest Uniform ROA at just 4%.
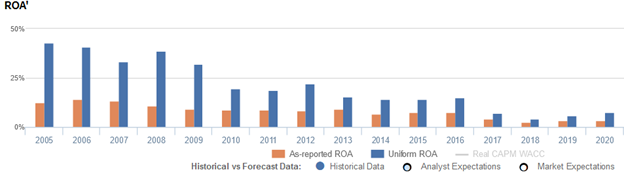
Moreover, Uniform ROA has steadily declined from a peak of 43% in 2005. While this may seem troubling, further context suggests that FEU’s downtrend is not as troubling as it may seem.
Unlike other businesses, FEU needs to invest in new buildings and campuses to grow the student population, which makes fixed costs that much higher. The drastic drop in ROA for 2010, 2013, and 2017 actually corresponds with the completion of their large investments.
Specifically, in 2010, FEU developed the Far Eastern College Silang campus and in 2013, the FEU Alabang campus. Meanwhile, in 2017, the company completed the construction of FEU High School, to adapt to the K-12 program and partly mitigate the loss of college admissions.
Despite these costly investments, FEU can’t just quickly and dramatically hike the tuition fee to turn a large profit. The company can only raise tuition fees at a certain percentage, stretching the time it takes to recover the investment but in a sustainable manner.
If FEU were to cease further large investments, its ROA will likely see a rebound. That said, even when the firm continues to focus on growing the asset base, its true profitability remains higher than perceived.
In 2020, as-reported ROA is only 4%, while Uniform ROA is nearly double that at 7%. What as-reported metrics fail to consider is FEU’s excess cash balance on the balance sheet.
While companies inherently need some level of cash to operate, the excess of that cash balance that is earning limited or no return ends up diluting as-reported ROAs.
When excess cash remains in the company’s asset base, the company’s profitability and capital efficiency may appear weaker than it actually is. Removing excess cash allows investors to see through the distortions that come from management carrying much more cash on the balance sheet than what is operationally required.
In 2020 particularly, FEU has been holding PHP 3.1 billion worth of excess cash, making up 20% of the company’s as-reported assets.
Removing excess cash and applying the other adjustments Valens makes, FEU’s 4% as-reported ROA and PHP 15.2 billion asset base are adjusted to reveal its TRUE Uniform ROA of 7%, by essentially utilizing just PHP 8.9 billion of Uniform assets.
FEU’s historical earning power is stronger than you think

As-reported metrics can severely distort the market’s perception of a firm’s historical profitability. If you were to just look at as-reported ROA, you would think that FEU’s profitability has been weaker than real economic metrics have highlighted in each of the past sixteen years.
In reality, FEU’s true profitability has been significantly higher than its as-reported ROA every year. Specifically, as-reported ROA was 4% in 2020, but Uniform ROA was at 7%.
As-reported ROA improved from 12% in 2005 to only 14% peaks in 2006-2007, before slowly fading to 3%-4% levels from 2017-2020.
Meanwhile, after declining from a high of 43% in 2005 to 34% in 2007, Uniform ROA recovered to 39% in 2008. Then, Uniform ROA steadily declined to a low of 4% in 2018, before rising to 7% in 2020.
FEU’s historical asset turns are stronger than you think
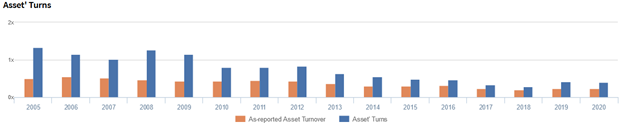
Strength and overall declines in FEU’s Uniform ROA have been driven primarily by trends in Uniform asset turns. In fact, Uniform turns have been higher than as-reported asset turnover in each of the past sixteen years.
Since 2005, as-reported asset turnover has slowly contracted from 0.5x highs in 2005-2008 to 0.2x lows in 2017-2020.
Meanwhile, Uniform turns fell from 1.3x in 2005 to 1.0x in 2007, before rebounding back to 1.3x in 2008. Thereafter, Uniform turns declined to 0.3x in 2017-2018, before recovering to 0.4x in 2019-2020.
Looking at the firm’s turns alone, the as-reported metrics are making the firm appear to be a less asset efficient business than is accurate.
SUMMARY and The Far Eastern University, Incorporated Tearsheet
As the Uniform Accounting tearsheet for The Far Eastern University, Incorporated (FEU:PHL) highlights, the Uniform P/E trades at 30.5x, which is above corporate averages but around its own history.
High P/Es require high EPS growth to sustain them. In the case of FEU, the company has recently shown a 42% Uniform EPS growth.
Sell-side analysts provide stock and valuation recommendations that provide very poor guidance or insight in general. However, sell-side analysts’ near-term earnings forecasts tend to have relevant information.
We take sell-side forecasts for Philippine Financial Reporting Standards (PFRS) earnings and convert them to Uniform earnings forecasts. When we do this, FEU’s sell-side analyst-driven forecast calls for a 30% and 5% Uniform EPS decline in 2021 and 2022, respectively.
Based on current stock market valuations, we can use earnings growth valuation metrics to back into the required growth rate to justify FEU’s PHP 560.00 stock price. These are often referred to as market embedded expectations.
The company needs Uniform earnings to grow by 2% each year over the next three years to justify current valuations. What sell-side analysts expect for FEU’s earnings growth is below what the current stock market valuation requires in 2020 and 2021.
Furthermore, the company’s earning power is just around long-run corporate averages. However, cash flows and cash on hand are 170% of its total obligations—including debt maturities, capex maintenance, and dividends. Together, this signals low credit and dividend risk.
To conclude, FEU’s Uniform earnings growth is below peer averages in 2020, but the company is trading well above its peer average valuations.
About the Philippine Market Daily
“Tuesday Uniform Earnings Tearsheets – Philippine-listed Focus”
Some of the world’s greatest investors learned from the Father of Value Investing or have learned to follow his investment philosophy very closely. That pioneer of value investing is Professor Benjamin Graham. His followers:
Warren Buffett and Charles Munger of Berkshire Hathaway; Shelby C. Davis of Davis Funds; Marty Whitman of Third Avenue Value Fund; Jean-Marie Eveillard of First Eagle; Mitch Julis of Canyon Capital; just to name a few.
Each of these great investors studied security analysis and valuation, applying this methodology to manage their multi-billion dollar portfolios. They did this without relying on as-reported numbers.
Uniform Adjusted Financial Reporting Standards (UAFRS or Uniform Accounting) is an answer to the many inconsistencies present in GAAP and IFRS, as well as in PFRS.
Under IFRS, each company’s financial statements are rebuilt under a consistent set of rules, resulting in an apples-to-apples comparison. Resulting UAFRS-based earnings, assets, debts, cash flows from operations, investing, and financing, and other key elements become the basis for more reliable financial statement analysis.
Every Tuesday, we focus on one Philippine-listed company that’s particularly interesting from a UAFRS vs as-reported standpoint. We highlight one adjustment that illustrates why the as-reported numbers are unreliable.
This way, we gain a better understanding of the factors driving a particular stock’s returns, and whether or not the firm’s true profitability is reflected in its current valuations.
Hope you’ve found this week’s Uniform Earnings Tearsheet on a Philippine company interesting and insightful.
Stay tuned for next week’s Philippine company highlight!
Regards,
Angelica Lim
Research Director
Philippine Markets Daily
Powered by Valens Research
www.valens-research.com


