
By aggressively acquiring gaming rights and developers to achieve global expansion, this gaming giant locked in Uniform returns of 100%+

This company has been making investments to take advantage of the growing online gaming industry.
However, as-reported metrics do not seem to reflect these efforts. On the other hand, Uniform Accounting shows that the business has a better Uniform return on assets (ROA) than what you might think.
Also below, Uniform Accounting Embedded Expectations Analysis and the Uniform Accounting Performance and Valuation Tearsheet for the company.
Philippine Markets Daily:
Wednesday Uniform Earnings Tearsheets – Asia-listed Focus
Powered by Valens Research
The online gaming industry has been on the rise since the early 2000s when massively multiplayer online role-playing games (MMORPG) gained popularity on PCs.
Then in the 2010s when consumers could purchase smartphones or tablets, online gaming started shifting to mobile.
In 2019, the mobile gaming segment accounted for about 45% of online gaming’s USD 152 billion revenue as about 2.4 billion people played mobile games, according to Newzoo, an intelligence provider for games and esports.
This growth is likely to continue, with mobile gaming expected to take 50% of nearly USD 200 billion forecast revenues for online gaming in 2022. This isn’t surprising, especially since consumers have shifted to online games as an alternative source of entertainment during the pandemic.
Additionally, technologies like artificial intelligence (AI), cloud gaming, and 5G are bringing more opportunities in the space.
Today’s company has been taking advantage of the trends in the online gaming market.
NEXON Co Ltd. is a global leader in online games and is one of the biggest gaming companies in Asia in terms of revenue and market capitalization. Currently, it has more than 60 live games in different genres played in over 190 countries.
Its focus on recreating its success in Asian markets to the Western market has pushed this company to aggressively purchase rights on popular game properties and foster strong partnerships.
In late 2017, NEXON bought Pixelberry Studios, an interactive mobile game developer. While NEXON supported the developer’s game distribution, Pixelberry’s hugely popular game, Choices, was the primary contributor for doubling the company’s U.S. revenue .
In 2018, the company announced a strategic investment in Embark Studios AB, a company founded by Electronic Arts’ (EA) former EVP, Patrick Söderlund. The following year, NEXON decided to fully acquire Embark, emphasizing its focus on its global game development strategy. With this, NEXON is able to have a better reach on Western markets and also take advantage of Embark’s expertise in creating popular games.
During early 2020, NEXON also acquired Reimagine Solutions, XCentral, and Kiandra IT. These technology firms have set the stage for NEXON to expand in Australia and boost the company’s IT offerings.
Moreover, NEXON is responding to the current shift from traditional to interactive entertainment with its plans to invest USD 1.5 billion into publicly-listed entertainment companies. This lays the foundation of attaining one of the gaming giant’s long-term goals of maintaining its position in entertainment markets by securing intellectual properties in multiple platforms.
Given NEXON’s acquisition and investment strategies to ramp up its game development capabilities, investors would expect the company to have solid returns. As-reported metrics display decent returns, with ROAs ranging from 9% to 17%.
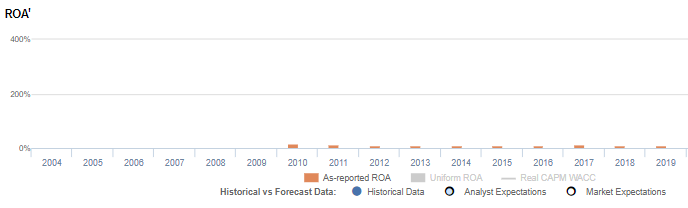
However, Uniform Accounting reveals that the company’s Uniform returns have been consistently more robust than what as-reported metrics show. For example, Uniform ROA was actually at 105% in 2019, which is more than 10x stronger than the 10% as-reported.
What as-reported metrics fail to do is to consider the company’s excess cash on the balance sheet. While most companies inherently need some level of cash to operate, the portion of that balance that is earning limited or no return—or excess cash—ends up diluting as-reported ROAs.
When excess cash remains included in the company’s asset base while computing its performance metrics, the company’s profitability and capital efficiency may appear weaker than it actually is. Removing excess cash allows investors to see through the distortions that come from management carrying much more cash on the balance sheet than what is operationally required.
From 2009 to 2019, NEXON has had a significant amount of excess cash sitting idly in its balance sheet, ranging from 20% to 72% of its as-reported total assets.
After excess cash and other significant adjustments are made, we can see that NEXON’s returns are actually a lot stronger than what as-reported metrics show. Without these adjustments, it appears that the company hasn’t been benefiting from its expansion investments, leading to significantly poorer valuations.
NEXON’s profitability is more robust than you think

As-reported metrics are distorting the market’s perception of the firm’s profitability. If you were to just look at as-reported ROA, you would think that the company is a weaker business than real economic metrics reveal.
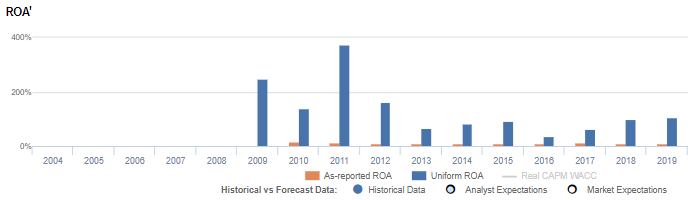
NEXON’s Uniform ROA has been higher than its as-reported ROA in the past eleven years. For example, when Uniform ROA peaked at 375%, as-reported ROA was only 13%.
The company’s Uniform ROA for the past eleven years has ranged from 38% to 375%, while as-reported ROA has ranged only from 9% to 17% in the same timeframe.
Specifically, Uniform ROA rose from 274% in 2009 to 375% in 2011, before falling to 38% in 2016. It then rebounded to 105% in 2019.
NEXON’s Uniform earnings margin are weaker than you think but its robust Uniform asset turns make up for it
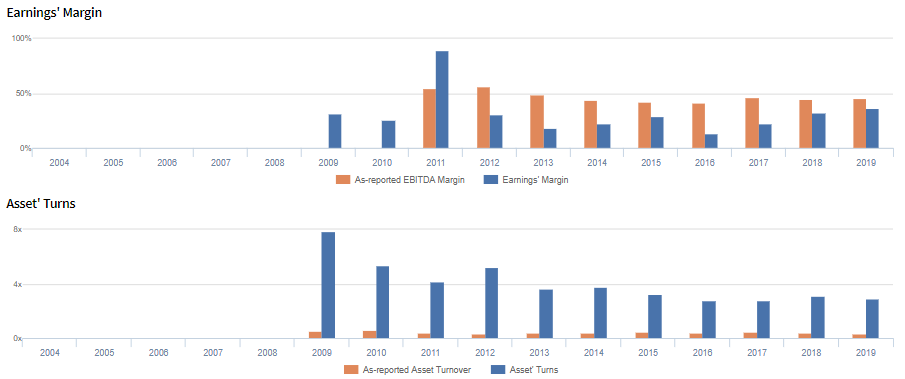
Volatility in Uniform ROA has been driven by trends in both Uniform earnings margins and Uniform asset turns, with peaks and troughs lining up historically with that of Uniform ROA.
Uniform margins rose from 31% in 2009 to 89% in 2011, before falling gradually to 13% in 2016. It then rebounded to 36% in 2019.
Meanwhile, Uniform turns gradually fell from 7.9x in 2009 to 2.9x in 2019.
SUMMARY and NEXON Co., Ltd. Tearsheet
As the Uniform Accounting tearsheet for NEXON Co., Ltd. (3659:JPN) highlights, the Uniform P/E trades at 25.7x, which is around the global corporate average of 25.2x but above its own historical average of 14.1x.
Moderate P/Es require moderate EPS growth to sustain them. That said, in the case of NEXON, the company has recently shown a 6% Uniform EPS growth.
Sell-side analysts provide stock and valuation recommendations that in general provide very poor guidance or insight. However, sell-side analysts’ near-term earnings forecasts tend to have relevant information.
We take sell-side forecasts for Japan’s Modified International Standards (JMIS) earnings and convert them to Uniform earnings forecasts. When we do this, NEXON’s sell-side analyst-driven forecast is a 1% and 16% EPS growth in 2020 and 2021, respectively.
Based on the current stock market valuations, we can use earnings growth valuation metrics to back into the required growth rate to justify NEXON’s JPY 3,615 stock price. These are often referred to as market embedded expectations.
NEXON is currently being valued as if Uniform earnings were to grow 4% annually over the next three years. What sell-side analysts expect for NEXON’s earnings growth is below what the current stock market valuation requires in 2020, but above that requirement in 2021.
Furthermore, the company’s earning power is 18x above the long-run corporate average. Also, cash flows and cash on hand are significantly above its total obligations—including debt maturities, and capex maintenance. All in all, this signals a low credit and dividend risk.
To conclude, NEXON’s Uniform earnings growth is in line with its peer averages, and the company is also trading in line with its average peer valuations.
About the Philippine Market Daily
“Wednesday Uniform Earnings Tearsheets – Asia-listed Focus”
Some of the world’s greatest investors learned from the Father of Value Investing or have learned to follow his investment philosophy very closely. That pioneer of value investing is Professor Benjamin Graham. His followers:
Warren Buffett and Charles Munger of Berkshire Hathaway; Shelby C. Davis of Davis Funds; Marty Whitman of Third Avenue Value Fund; Jean-Marie Eveillard of First Eagle; Mitch Julis of Canyon Capital; just to name a few.
Each of these great investors studied security analysis and valuation, applying this methodology to manage their multi-billion dollar portfolios. They did this without relying on as-reported numbers.
Uniform Adjusted Financial Reporting Standards (UAFRS or Uniform Accounting) is an answer to the many inconsistencies present in GAAP and IFRS, as well as in PFRS.
Under UAFRS, each company’s financial statements are rebuilt under a consistent set of rules, resulting in an apples-to-apples comparison. Resulting UAFRS-based earnings, assets, debts, cash flows from operations, investing, and financing, and other key elements become the basis for more reliable financial statement analysis.
Every Wednesday, we focus on one company listed in Asia that’s relevant to the Philippines and that’s particularly interesting from a UAFRS vs as-reported standpoint. We highlight one adjustment that illustrates why the as-reported numbers are unreliable.
This way, we gain a better understanding of the factors driving a particular stock’s returns, and whether or not the firm’s true profitability is reflected in its current valuations.
Hope you’ve found this week’s Uniform Earning Tearsheet on an Asian company interesting and insightful.
Stay tuned for next week’s Asia company highlight!
Regards,
Angelica Lim
Research Director
Philippine Markets Daily
Powered by Valens Research
www.valens-research.com


