
Conquering the casual side of office fashion led to higher profitability for this known work-attire seller, resulting in 31% Uniform ROA

Fashion and clothing brands are often short-lived and unsustainable due to the industry’s cut-throat environment.
This Japanese clothing brand combats high competition by producing apparel suitable to many different types of customers. However, its as-reported metrics downplay its success.
Also below, Uniform Accounting Embedded Expectations Analysis and the Uniform Accounting Performance and Valuation Tearsheet for the company.
Philippine Markets Daily:
Wednesday Uniform Earnings Tearsheets – Asia-listed Focus
Powered by Valens Research
Apparel serves as an avenue of expression, indicating one’s unique preference and even cultural traditions. The rise of fast fashion in the past decade is a testament of how more people have come to value style at affordable prices, regardless of quality.
On the other side of the fashion spectrum is athleisure, another recent trend that has changed consumer behavior. Here, comfort is given more priority over style for everyday wear.
Uniqlo is often the brand that we picture when we think about high-quality apparel for relatively low prices. This leading brand is increasingly popular globally as it caters to the general public, producing items that suit the needs of all consumers.
Similar to Uniqlo is Japan’s Workman. However, as the name suggests, the latter specializes in work-related attire and accessories.
This Japanese brand managed to attract a diverse set of customers, resulting in workwear clothing that can double as everyday wear.
At first glance, the brand does not necessarily exude stylish clothing aesthetics as it leans on the business casual side. However, its creation of private labels aimed to address just that.
By launching Workman Plus in 2018, its athleisure and casual line, the brand gained traction among women and even pregnant women for that matter.
Workman’s initiative to constantly innovate and roll with the times has proved successful in the past decade, as shown by its profit having grown sixfold in that period.
The brand’s massive success has even changed the way investors see small and mid-cap companies, particularly their profitability growth potential. Specifically, portfolio management company Comgest Asset Management Japan acquired shares in the company and then further increased its stake.
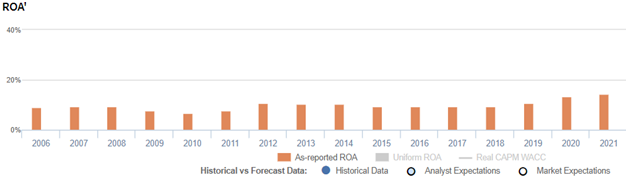
Despite demand for Workman’s products increasing during the pandemic, its as-reported metrics actually still downplay its success with return on assets ranging from only 7% to 14% in the past sixteen years.
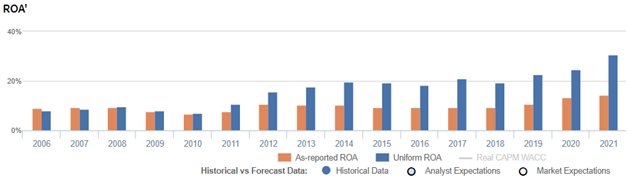
This does not fully capture Workman’s true profitability. Using Uniform Accounting we can see that the company’s returns are actually stronger than what as-reported metrics show, ranging from 7% to 31%.

What as-reported metrics fail to do is to consider the company’s excess cash on the balance sheet. While most companies inherently need some level of cash to operate, the portion of that balance that is earning limited or no return—or excess cash—ends up diluting as-reported ROAs.
When excess cash remains included in the company’s asset base while computing its performance metrics, the company’s profitability and capital efficiency may appear weaker than it actually is.
Removing excess cash allows investors to see through the distortions that come from management carrying much more cash on the balance sheet than what is operationally required.
From 2006 to 2021, Workman has had a significant amount of excess cash sitting idly in its balance sheet, ranging from 16% to 49% of its as-reported total assets.
After excess cash and other necessary adjustments are made, we can see that Workman’s current returns are actually a lot stronger than what as-reported metrics show. Without these adjustments, it appears that the company’s product diversification initiatives are not translating into profitability, leading to significantly poorer valuations.
Workman’s profitability is much more robust than you think
As-reported metrics are distorting the market’s perception of the firm’s profitability. If you were to just look at as-reported ROA, you would think that the company is a weaker business than real economic metrics reveal.
Workman’s Uniform ROA has been higher than its as-reported ROA in the past fourteen years. For example, when Uniform ROA was at 31% in 2021, as-reported ROA was only less than half that at 14%.
The company’s Uniform ROA for the past sixteen years has ranged from 7% to 31%, while as-reported ROA has ranged only from 7% to 14% in the same timeframe.
Specifically, Uniform ROA remained at 8%-10% levels from 2006 to 2009, before declining to 7% in 2010. It then gradually climbed to 20% levels in 2014, and eventually peaked at 31% in 2021.
Workman’s Uniform earnings margins are weaker than you think but its robust Uniform asset turns make up for it
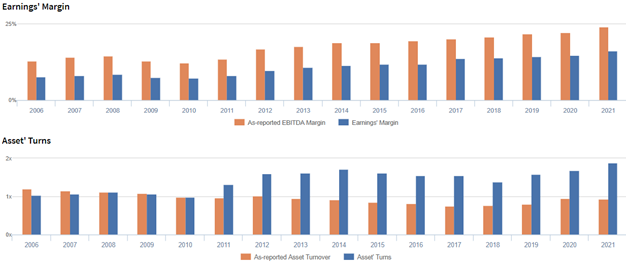
Volatility in Uniform ROA has been driven by trends in both Uniform earnings margin and Uniform asset turns, with peaks and troughs lining up historically with that of Uniform ROA.
Uniform margins remained at 7%-8% levels from 2006 to 2011, before gradually peaking at 16% in 2021.
Meanwhile, Uniform turns were at 1.0x-1.1x levels from 2006 to 2010, before rising to 1.7x in 2014. It then declined to 1.4x in 2018 before recovering to 1.9x in 2021.
SUMMARY and Workman Co., Ltd. Tearsheet
As the Uniform Accounting tearsheet for Workman Co., Ltd. (7564:JPN) highlights, the Uniform P/E trades at 28.0x, which is above the global corporate average of 21.9x and around its own historical average of 29.5x.
High P/Es require high EPS growth to sustain them. In the case of Workman, the company has recently shown a 27% Uniform EPS growth.
Sell-side analysts provide stock and valuation recommendations that in general provide very poor guidance or insight. However, sell-side analysts’ near-term earnings forecasts tend to have relevant information.
We take sell-side forecasts for Japan’s Modified International Standards (JMIS) earnings and convert them to Uniform earnings forecasts. When we do this, Workman’s sell-side analyst-driven forecast is a 12% EPS growth in both 2022 and 2023.
Based on the current stock market valuations, we can use earnings growth valuation metrics to back into the required growth rate to justify Workman’s JPY 7,180 stock price. These are often referred to as market embedded expectations.
The company is currently being valued as if Uniform earnings were to grow 7% annually over the next three years. What sell-side analysts expect for Workman’s earnings growth is above what the current stock market valuation requires in 2022 and 2023.
Furthermore, the company’s earning power is 5x above the long-run corporate average. Also, cash flows and cash on hand are more than 9x its total obligations—including debt maturities, capex maintenance, and dividends. All in all, this signals a low credit and dividend risk.
To conclude, Workman’s Uniform earnings growth is above its peer averages and the company is also trading above its average peer valuations.
About the Philippine Market Daily
“Wednesday Uniform Earnings Tearsheets – Asia-listed Focus”
Some of the world’s greatest investors learned from the Father of Value Investing or have learned to follow his investment philosophy very closely. That pioneer of value investing is Professor Benjamin Graham. His followers:
Warren Buffett and Charles Munger of Berkshire Hathaway; Shelby C. Davis of Davis Funds; Marty Whitman of Third Avenue Value Fund; Jean-Marie Eveillard of First Eagle; Mitch Julis of Canyon Capital; just to name a few.
Each of these great investors studied security analysis and valuation, applying this methodology to manage their multi-billion dollar portfolios. They did this without relying on as-reported numbers.
Uniform Adjusted Financial Reporting Standards (UAFRS or Uniform Accounting) is an answer to the many inconsistencies present in GAAP and IFRS, as well as in PFRS.
Under UAFRS, each company’s financial statements are rebuilt under a consistent set of rules, resulting in an apples-to-apples comparison. Resulting UAFRS-based earnings, assets, debts, cash flows from operations, investing, and financing, and other key elements become the basis for more reliable financial statement analysis.
Every Wednesday, we focus on one company listed in Asia that’s relevant to the Philippines and that’s particularly interesting from a UAFRS vs as-reported standpoint. We highlight one adjustment that illustrates why the as-reported numbers are unreliable.
This way, we gain a better understanding of the factors driving a particular stock’s returns, and whether or not the firm’s true profitability is reflected in its current valuations.
Hope you’ve found this week’s Uniform Earning Tearsheet on an Asian company interesting and insightful.
Stay tuned for next week’s Asia company highlight!
Regards,
Angelica Lim
Research Director
Philippine Markets Daily
Powered by Valens Research
www.valens-research.com


