
Despite Japan’s aging population, this baby products maker was able to thrive through diversification and expansion that resulted in 21% returns

This baby products company continues to thrive even as Japan’s population continues to age while its birth rate dwindles.
As-reported metrics seem to recognize the company’s efforts to diversify and expand. However, Uniform Accounting shows more robust returns than what the market thinks.
Also below, Uniform Accounting Embedded Expectations Analysis and the Uniform Accounting Performance and Valuation Tearsheet for the company.
Philippine Markets Daily:
Wednesday Uniform Earnings Tearsheets – Asia-listed Focus
Powered by Valens Research
It’s been roughly two million years since humans started walking the earth. Several evolutions later, the human population has grown to an incredible 7.9 billion worldwide, with 385,000 babies born per day.
However, population growth is declining, with forecasts estimating it to stop growing by the year 2100 at 10.9 billion. While this is still a ways away, there is another more immediate cause for concern.
Some countries are already experiencing the economic effects of an aging population, which impacts productivity and labor supplies. This is particularly prevalent in the East Asian region, with total fertility rates (TFR), or the average number of children born per woman, to be below 1.0. For a population to be considered stable, TFR should be 2.1.
Interestingly, even with global birth rates declining, the baby product industry was valued at $64 million in 2019 and is still estimated to reach $88.7 million by 2027. The reason for this is the increased focus on baby health concerns such as nutrition and vaccinations, with 2020 further highlighting these worries. As a result, the industry still enjoys a steady growth rate, with Asia being the fastest growing market.
With its home base in Japan, one company has been a major player in the baby product industry for more than half a century.
Pigeon Corporation, previously known as Pigeon Honyuki Honpo, was established in 1957 and started off as just a baby bottle manufacturer. Over time, it has diversified its offerings into other baby and mother care products like baby weaning products, baby skin skin care, wet tissues, among others.
The company expanded throughout Japan, setting up manufacturing plants and offices in the country’s main cities, becoming a domestic market leader for baby products.
In the 1970s, to counter the demographic risk of declining birth rates and an aging population, the company further diversified its products. It opened another line of business offering elderly care products to take advantage of Japan’s aging population.
Pigeon also expanded overseas to participate in new markets. As of today, the company has a presence in other Asian countries like Singapore, Thailand, Malaysia, Indonesia, India, and China, in addition to also operating in the U.S. For the past five years, its overseas operations accounted for 50%-58% of its total revenues.
Given the company’s international expansion and product diversification, investors are expecting the company to be able to continue expanding its customer base, which should lead to robust profitability.
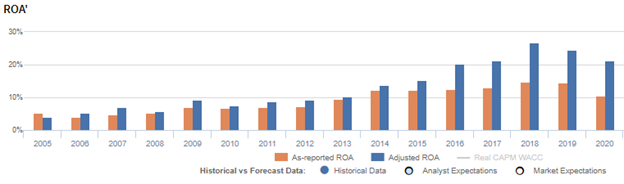
As-reported metrics seem to take all of these into account. For the past sixteen years, Pigeon’s as-reported ROAs have increased from 5% in 2005 to 10% in 2020.
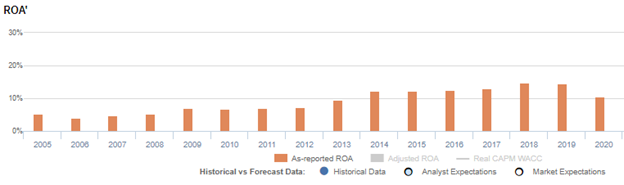
Uniform Accounting, however, sees that the company’s international growth and product diversification have actually resulted in more robust returns than what as-reported metrics show. Specifically, Pigeon’s Uniform ROA grew from just 4% in 2005 to higher levels of 21% in 2020.

What as-reported metrics fail to do is to consider the company’s excess cash on the balance sheet. While most companies inherently need some level of cash to operate, the portion of that balance that is earning limited or no return—or excess cash—ends up diluting as-reported ROAs.
When excess cash remains included in the company’s asset base while computing its performance metrics, the company’s profitability and capital efficiency may appear weaker than it actually is.
Removing excess cash allows investors to see through the distortions that come from management carrying much more cash on the balance sheet than what is operationally required.
From 2012 to 2020, Pigeon has had a significant amount of excess cash sitting idly in its balance sheet, ranging from 10% to 32% of its as-reported total assets.
After excess cash and other necessary adjustments are made, we can see that Pigeon’s current returns are actually a lot stronger than what as-reported metrics show.
Pigeon’s profitability is much more robust than you think
As-reported metrics are distorting the market’s perception of the firm’s profitability. If you were to just look at as-reported ROA, you would think that the company is a weaker business than real economic metrics reveal.
Pigeon’s Uniform ROA has been higher than its as-reported ROA in recent years. For example, when Uniform ROA was at 21% in 2020, as-reported ROA was only 10%.
The company’s Uniform ROA for the past sixteen years has ranged from 4% to 27%, while as-reported ROA has ranged only from 5% to 15% in the same timeframe.
Specifically, Uniform ROA gradually climbed from 4% in 2005 to 27% peak levels in 2018, before declining to 21% in 2020.
Pigeon’s Uniform earnings margins are weaker than you think but its robust Uniform asset turns make up for it

Volatility in Uniform ROA has been driven by trends in both Uniform earnings margin and Uniform asset turns, with peaks and troughs lining up historically with that of Uniform ROA.
Uniform margins gradually rose from 3% in 2005 to 14% levels in 2018-2019, before slightly declining to 13% in 2020.
Meanwhile, Uniform turns remained stable at 1.3x-1.5x levels from 2005 to 2015, before reaching a 1.9x peak in 2018, and then declining to 1.6x in 2020.
SUMMARY and Pigeon Corporation Tearsheet
As the Uniform Accounting tearsheet for Pigeon Corporation (7956:JPN) highlights, the Uniform P/E trades at 31.5x, which is above the global corporate average of 23.7x but below its own historical average of 34.4x.
High P/Es require high EPS growth to sustain them. In the case of Pigeon, the company has recently shown a 4% Uniform EPS contraction.
Sell-side analysts provide stock and valuation recommendations that in general provide very poor guidance or insight. However, sell-side analysts’ near-term earnings forecasts tend to have relevant information.
We take sell-side forecasts for Japan’s Modified International Standards (JMIS) earnings and convert them to Uniform earnings forecasts. When we do this, Pigeon’s sell-side analyst-driven forecast is a 19% EPS decline in 2021 and a 13% EPS growth in 2022.
Based on the current stock market valuations, we can use earnings growth valuation metrics to back into the required growth rate to justify Pigeon’s JPY 4,105 stock price. These are often referred to as market embedded expectations.
Pigeon is currently being valued as if Uniform earnings were to grow 6% annually over the next three years. What sell-side analysts expect for Pigeon’s earnings growth is below what the current stock market valuation requires in 2021 but above that requirement in 2022.
Furthermore, the company’s earning power is 4x above the long-run corporate average. Also, cash flows and cash on hand are almost 4x its total obligations—including debt maturities, capex maintenance, and dividends. All in all, this signals a low credit and dividend risk.
To conclude, Pigeon’s Uniform earnings growth is below its peer averages, but the company is also trading above its average peer valuations.
About the Philippine Markets Daily
“Wednesday Uniform Earnings Tearsheets – Asia-listed Focus”
Some of the world’s greatest investors learned from the Father of Value Investing or have learned to follow his investment philosophy very closely. That pioneer of value investing is Professor Benjamin Graham. His followers:
Warren Buffett and Charles Munger of Berkshire Hathaway; Shelby C. Davis of Davis Funds; Marty Whitman of Third Avenue Value Fund; Jean-Marie Eveillard of First Eagle; Mitch Julis of Canyon Capital; just to name a few.
Each of these great investors studied security analysis and valuation, applying this methodology to manage their multi-billion dollar portfolios. They did this without relying on as-reported numbers.
Uniform Adjusted Financial Reporting Standards (UAFRS or Uniform Accounting) is an answer to the many inconsistencies present in GAAP and IFRS, as well as in PFRS.
Under UAFRS, each company’s financial statements are rebuilt under a consistent set of rules, resulting in an apples-to-apples comparison. Resulting UAFRS-based earnings, assets, debts, cash flows from operations, investing, and financing, and other key elements become the basis for more reliable financial statement analysis.
Every Wednesday, we focus on one company listed in Asia that’s relevant to the Philippines and that’s particularly interesting from a UAFRS vs as-reported standpoint. We highlight one adjustment that illustrates why the as-reported numbers are unreliable.
This way, we gain a better understanding of the factors driving a particular stock’s returns, and whether or not the firm’s true profitability is reflected in its current valuations.
Hope you’ve found this week’s Uniform Earning Tearsheet on an Asian company interesting and insightful.
Stay tuned for next week’s Asia company highlight!
Regards,
Angelica Lim
Research Director
Philippine Markets Daily
Powered by Valens Research
www.valens-research.com


