
Game over? Not yet! Pass go and collect 200. This toymaker shifted its strategic focus and delivered a Uniform ROA of 20%+

The 2017 bankruptcy of Toys R Us left major toymakers struggling to find a distribution channel replacement for their products.
Despite losing their third-largest client, this toymaker’s shift in strategic focus enabled it to depend less on toy distribution and transform itself into a global entertainment licensing powerhouse by monetizing its brands across multiple avenues.
However, as-reported metrics show that this company’s transformation strategy hasn’t been able to recreate the profitable channel it lost when Toys R Us went bankrupt. In reality, TRUE UAFRS-based (Uniform) return on assets (ROA) show that the strategy drove returns back to previous highs.
Also below, Uniform Accounting Embedded Expectations Analysis and the Uniform Accounting Performance and Valuation Tearsheet for the company.
Philippine Markets Daily:
Thursday Uniform Earnings Tearsheets – Global Focus
Powered by Valens Research
Brick-and-mortar stores have had to scale back their retail presence massively over the past five years, with some going as far as fully closing all stores as e-commerce began to take over.
The “retail apocalypse” took down even the Goliaths of the industry, most notable of which was Toys R Us.
In late 2017, Toys R Us announced that it would be closing almost all of its stores in the US, Australia, and the UK, while keeping operations open in Asia, mostly in China and the Philippines.
Growing competition from lower-priced retailers Target, Walmart, and Amazon, as well as the Toys R Us’ mounting debt, contributed significantly to the downfall of the toy store giant.
The bankruptcy caused a ripple effect that severely impacted Hasbro, Inc.’s (HAS) revenues. With Toys R Us being its third largest customer in the US, and second largest in Europe and Asia, the plunge in Hasbro’s sales was expected even with the holiday season push.
While the company did lose a major distributor, and lost out on a considerable amount of revenue, there was a silver lining—it could shift its focus towards a more sustainable strategy that depended less on toy distribution.
Following the footsteps of Disney, Hasbro leveraged their well-known brands and monetized them into value-creating growth opportunities.
Brian Goldner, Hasbro’s CEO, sold off some of the company’s low-margin toy manufacturing plants and pushed its core brands into more lucrative platforms.
This began in 2007 with the release of the first Transformers film. It has since grown into a multibillion-dollar franchise, with six films produced in total and a seventh set for release in 2021.
The Transformers franchise also moved into television, digital gaming, publishing, apparel, and theme parks.
Similarly, the company’s My Little Pony brand found success in digital media. Its television series had over 200+ episodes airing in 180 countries, including on platforms such as iTunes and Netflix.
To further increase their franchisable brands, Hasbro acquired Entertainment One (eOne) in December 2019 in a $4 billion deal that included the rights to the animated kids shows “Peppa Pig” and “PJ Masks,” and the hit zombie apocalypse series “The Walking Dead.”
The deal also included eOne’s music business, which produces music by the rock group The Lumineers, and owns the rights to the catalog of Dr. Dre, Tupac, and Snoop Dogg.
Overall, the acquisition is expected to deliver strong cash flows while also increasing Hasbro’s pipeline of brands that it can monetize.
While the bankruptcy of Toys R Us had Hasbro focusing on its franchise-centered strategy, it hasn’t completely abandoned its toy manufacturing business.
Hasbro partnered with Epic Games’ Fortnite and Disney’s Marvel and Star Wars to create versions of its beloved toys using these brands.
The Fortnite version of Monopoly and Nerf guns were a hit, raking in Hasbro’s biggest sales for the board game. As for its partnership with Disney, its money makers were toys from Frozen, the Avengers: Endgame, Spiderman, and the Rise of Skywalker.
Given Hasbro’s transformation from a purely toy manufacturing company to a global entertainment licensing juggernaut, the company is expected to have robust returns even after the Toys R Us debacle in 2017.
However, looking at as-reported metrics, it seems that the bankruptcy took a severe toll on Hasbro’s profitability, with ROAs steadily sinking to record lows.

In reality, Uniform metrics show that the transformation strategy has actually steered the company back to previous high ROA levels.

In fact, in the last sixteen years, Uniform metrics show profitability that is a lot stronger than what as-reported data states. Uniform ROAs are actually materially more robust than as-reported ROAs in recent years.
What as-reported metrics fail to do is to consider excess cash on the balance sheet. While most companies inherently need some level of cash to operate, the portion of that balance that is earning limited or no return—or excess cash—ends up diluting as-reported ROAs.
The purpose of removing excess cash is to see what the true operating ROA of the firm is. Removing excess cash allows investors to see through the distortions that come from management carrying much more cash on the balance sheet than what is operationally required.
In the case of Hasbro, the company had a substantial excess cash balance in the amount of $2.4 billion from the completed debt and equity financing in anticipation of the eOne acquisition in 2020. This materially overstates the company’s cash balances, inflating the asset base and causing profitability to look weaker than it really is.
Adjusting for excess cash, we can see that Hasbro’s actual returns have gone up from 16% in 2017 to 22% in 2019, while as-reported metrics have directionally misled investors.
Hasbro’s earning power is actually more robust than you think

As-reported metrics distort the market’s perception of the firm’s recent profitability. If you were to just look at as-reported ROA, you would think that the company is a much weaker business than real economic metrics highlight.
Hasbro’s Uniform ROA has actually been higher than its as-reported ROA in the past sixteen years. For example, as-reported ROA was 5% in 2019, but its Uniform ROA was actually 4x higher at 22%. When Uniform ROA peaked at 25% in 2007, as-reported ROA was only at 10%.
Through Uniform Accounting, we can see that the company’s true ROAs have actually been much higher. Hasbro’s Uniform ROA has ranged from 16% to 25% in the past sixteen years while as-reported ROA ranged only from 5% to 11% in the same timeframe.
After dropping from a peak of 25% in 2007 to 17% in 2013, Uniform ROA bounced back to 24% in 2016. Afterwards, Uniform ROA decreased to 22% in 2019.
Hasbro’s Uniform ROA is driven by significantly more robust Uniform asset turns but is offset by Uniform earnings margins
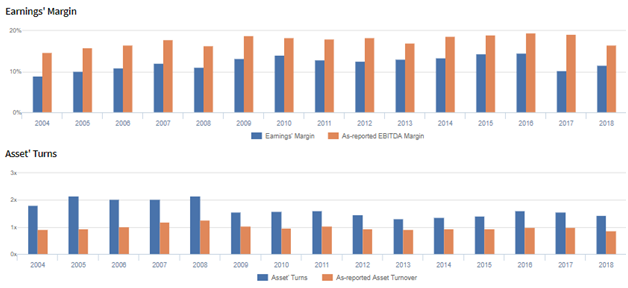
Hasbro’s profitability has been driven by trends in Uniform earnings margins and Uniform asset turns.
From 2004-2007, Uniform earnings margins increased from 9% to 12% levels. It further increased to 14% levels in 2010, before fading to 10% in 2017. It then bounced back to 16% levels in 2019.
Meanwhile, Uniform asset turns fell from a peak of 2.2x in 2005 to 1.6x in 2009. It remained there through 2011, before falling to 1.3x in 2013. It then bounced back to 1.6x levels in 2016, before fading to 1.4x.
At current valuations, markets are pricing in expectations for Uniform margins to reach new peaks, coupled with further stability in Uniform turns.
SUMMARY and Hasbro Tearsheet
As the Uniform Accounting tearsheet for Hasbro, Inc. (HAS) highlights, the Uniform P/E trades at 22.2x, which is around corporate average valuation levels and its own recent history.
Average P/Es require low average growth to sustain them. In the case of Hasbro, the company has recently shown a 44% Uniform EPS growth.
Wall Street analysts provide stock and valuation recommendations that in general provide very poor guidance or insight. However, Wall Street analysts’ near-term earnings forecasts tend to have relevant information.
We take Wall Street forecasts for GAAP earnings and convert them to Uniform earnings forecasts. When we do this, Hasbro’s Wall Street analyst-driven forecast is a 24% shrinkage in 2020 and a 29% growth in 2021.
Based on current stock market valuations, we can use earnings growth valuation metrics to back into the required growth rate to justify Hasbro’s $81 stock price. These are often referred to as market embedded expectations.
The company can have Uniform earnings shrink by 5% each year over the next three years and still justify current prices. What Wall Street analysts expect for Hasbro’s earnings growth is below what the current stock market valuation requires in 2020 and above this requirement in 2021.
Furthermore, the company’s earning power is 4x the corporate average. Also, cash flows are 2x higher than its total obligations—including debt maturities, capex maintenance, and dividends. Together, this signals low credit and dividend risk.
To conclude, Hasbro’s Uniform earnings growth is in line with peer averages in 2020. The company is also trading in line with average peer valuations.
About the Philippine Market Daily
“Thursday Uniform Earnings Tearsheets – Global focus”
Some of the world’s greatest investors learned from the Father of Value Investing or have learned to follow his investment philosophy very closely. That pioneer of value investing is Professor Benjamin Graham. His followers:
Warren Buffett and Charles Munger of Berkshire Hathaway; Shelby C. Davis of Davis Funds; Marty Whitman of Third Avenue Value Fund; Jean-Marie Eveillard of First Eagle; Mitch Julis of Canyon Capital; just to name a few.
Each of these great investors studied security analysis and valuation, applying this methodology to manage their multi-billion dollar portfolios. They did this without relying on as-reported numbers.
Uniform Adjusted Financial Reporting Standards (UAFRS or Uniform Accounting) is an answer to the many inconsistencies present in GAAP and IFRS, as well as in PFRS.
Under UAFRS, each company’s financial statements are rebuilt under a consistent set of rules, resulting in an apples-to-apples comparison. Resulting UAFRS-based earnings, assets, debts, cash flows from operations, investing, and financing, and other key elements become the basis for more reliable financial statement analysis.
Every Thursday, we focus on one multinational company that’s particularly interesting from a UAFRS vs as-reported standpoint. We highlight one adjustment that illustrates why the as-reported numbers are unreliable.
This way, we gain a better understanding of the factors driving a particular stock’s returns, and whether or not the firm’s true profitability is reflected in its current valuations.
Hope you’ve found this week’s Uniform earnings tearsheet on a multinational company interesting and insightful.
Stay tuned for next week’s multinational company highlight!
Regards,
Angelica Lim
Research Director
Philippine Markets Daily
Powered by Valens Research
www.valens-research.com


