
Having everything from A to Z made it easier for this tech giant to monetize its platform, producing Uniform ROAs of 24%+ in the process

Encyclopedias have been around for almost 2,000 years. It’s a comprehensive collection of facts on subjects such as history, math, science, among others. It’s also where most people sourced their research, or broader knowledge, from—that is, until the internet came along.
This internet company has made it easier for billions of people to access all knowledge that used to only be available from major print sources like encyclopedias… that and a whole lot more.
With the dominating success of its search engine, this company has moved into advertising to monetize its platform, which it has dominated in as well. But while as-reported metrics show that it is only a single-digit return firm, Uniform Accounting accurately reflects just how powerful its business and leadership in the internet space is.
Also below, Uniform Accounting Embedded Expectations Analysis and the Uniform Accounting Performance and Valuation Tearsheet for the company.
Philippine Markets Daily:
Thursday Uniform Earnings Tearsheets – Global Focus
Powered by Valens Research
One of the many tells of a successful brand is if it becomes synonymous to the thing that it is—like how we say Kleenex instead of tissue, or in the Philippines, we say Colgate instead of toothpaste.
Arguably, the top spot for popularity among these brands-turned-vocabulary belongs to Alphabet, Inc. (GOOGL), better known as Google.
“Google” became a popular substitute verb for “online search” in the early 2000s. The American Dialect Society named “Google” as the “most useful word of 2002,” becoming dictionary-official four years later.
Google has consistently dominated the search engine space, capturing about 87% of the total global market. It has invested heavily into building multiple data centers, which enables it to process massive amounts of data every day.
Its highly sophisticated and efficient infrastructure ensures that its users will get comprehensive search results at an incredible speed. A single Google search can return tens of billions of results in about half a second.
The company also continuously innovates and improves its algorithms to provide the most relevant results for its users. The optimized search results and the incredible speed at which it is done are the company’s competitive moats that keep users loyal to the service.
The company’s market leadership, its sticky customer base, and the strength of its brand plays well into how it successfully monetizes its core search engine operations.
Google moved from being just a search engine and expanded their digital assets over the past 15 years by developing additional features such as Gmail and Google Maps, and by acquiring video-sharing site Youtube.
Google’s entire domain, including its core search engine business, is known as the Google Network—and it’s irrefutably vast.
Because the search engine has such a large audience, it’s no surprise that its advertising reach is just as impressive, addressing about 90% of internet users worldwide.
Consequently, Google Ads, the firm’s advertising platform, is a popular choice among businesses whose digital marketing strategies require a large potential audience to pool a specific target market from. It uses a pay-per-click (PPC) model, which means that Google charges the advertised company every time a user clicks on their ad.
Furthermore, Google Ads’ system is based on the users’ search histories and keywords determined by the businesses so that the ads will appear only to the relevant target market. This enables the businesses’ marketing strategies to be as efficient as possible.
Through its unparalleled reach and intelligent system, Google Ads has immensely helped businesses increase their brand awareness and traffic to their online sites.
But while it seems that Google has consistently dominated the advertising space using its superb network, as-reported metrics don’t quite show that. Return on assets (ROAs) have been weak at 10% for the better part of the decade.
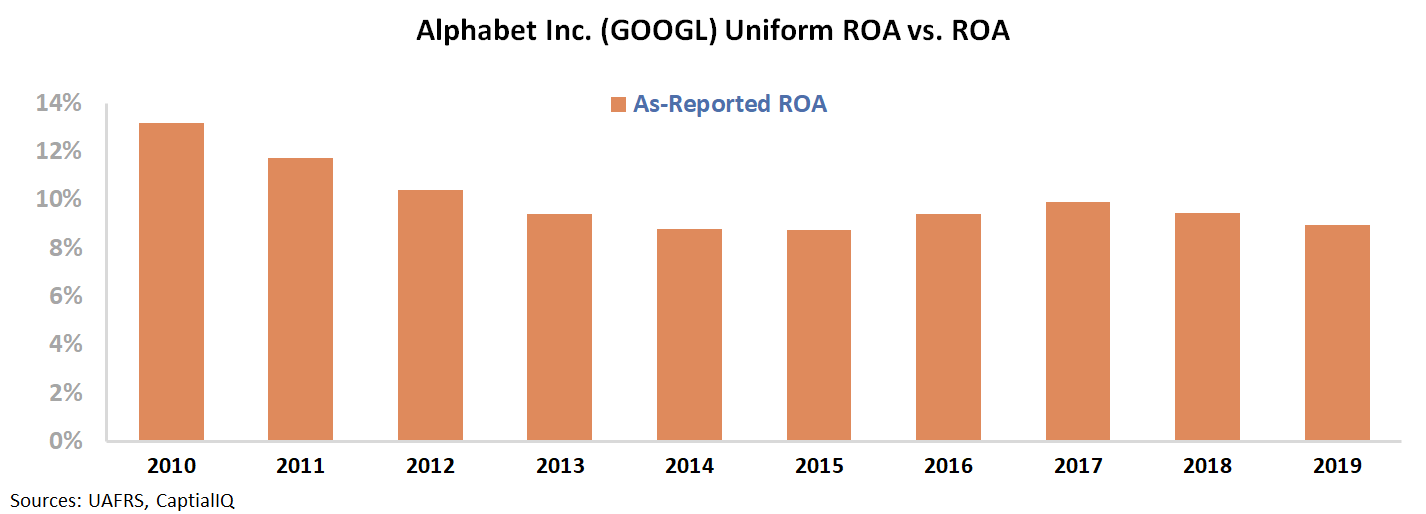
Uniform Accounting, on the other hand, portrays Google’s internet excellence more accurately, with Uniform ROAs that have not fallen below robust 24% levels.
The distortion between Uniform and as-reported ROAs comes from as-reported metrics incorrectly treating R&D as an expense.
R&D is an investment in the long-term cash flow generation of the company. By recording R&D as an expense, this violates one of the core principles of accounting, which is that expenses should be recognized in the period when the related revenue is incurred.
Since as-reported accounting records R&D on the income statement, as opposed to as an investment on the balance sheet, net income can become materially understated.
Google materially spends on R&D to continue optimizing their advertising platform and innovating other technologies to increase market reach. The company’s R&D spend has consistently been about 20% of total operating costs, or upwards of $15 billion annually.
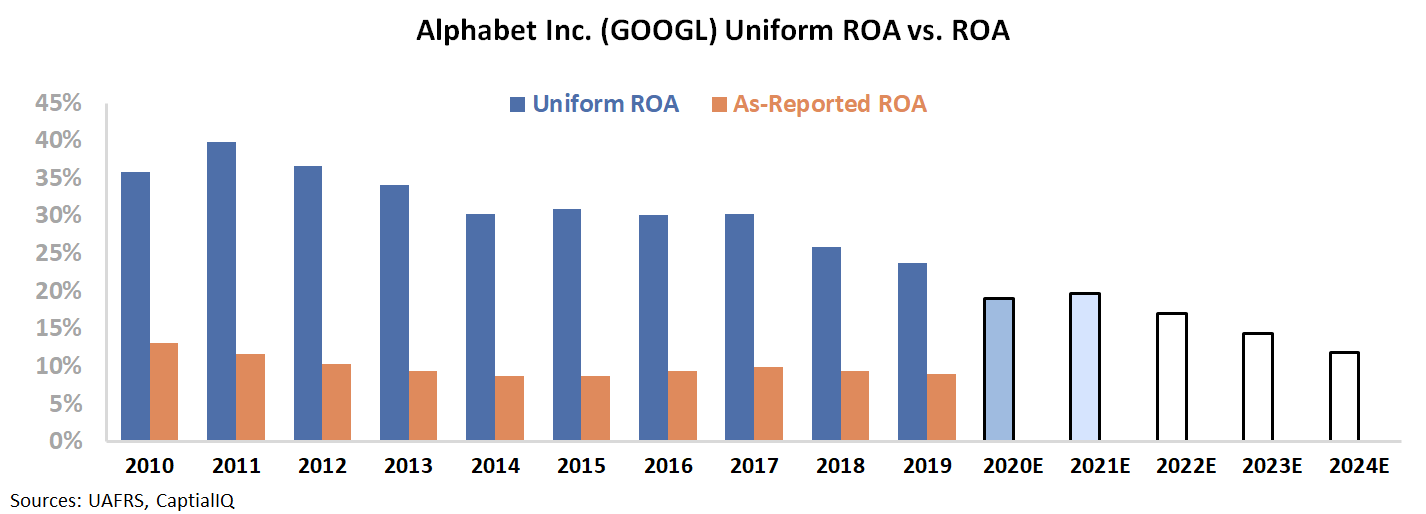
After adjustments, we can see that Google’s Uniform ROA has been at 24%-40% levels from 2010, which is materially higher than its as-reported ROA of 9%-13%. Without this adjustment, it will look like the firm is having less success with its R&D investments than it really is, leading to poorer valuations.
However, while robust, Uniform ROAs have been on a declining trend due to tightening competition from other advertising platforms such as Facebook and Instagram Ads, Microsoft Advertising, and AdRoll, among others.
Because of this, Uniform ROAs have fallen massively from a peak of 85% in 2004 to only 24% currently.
Alphabet’s earning power is actually more robust than you think
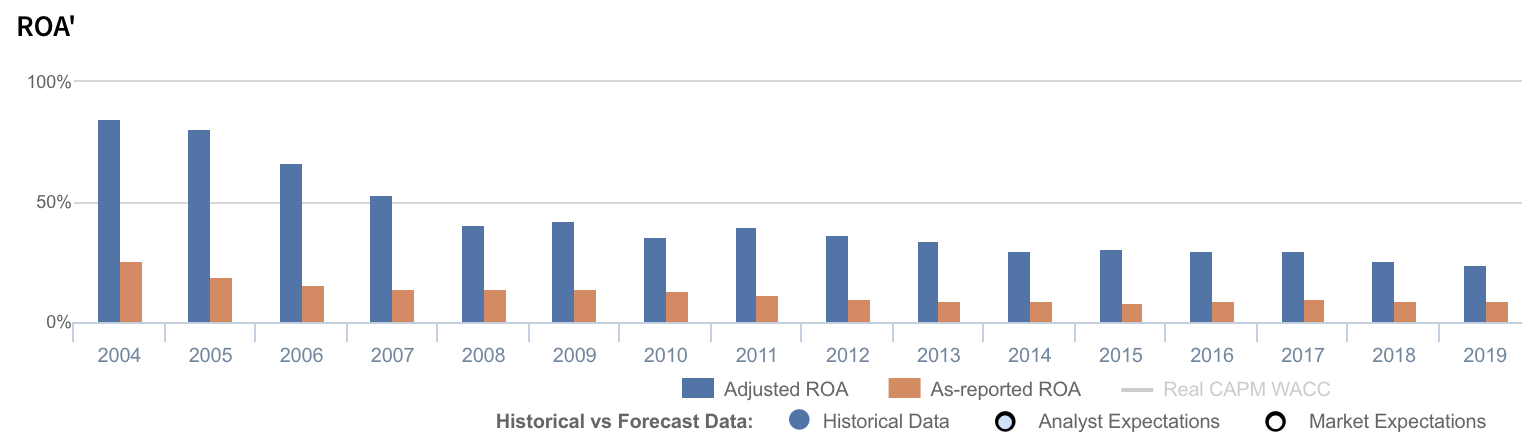
As-reported metrics distort the market’s perception of the firm’s recent profitability. If you were to just look at as-reported ROA, you would think that the company is a much weaker business than real economic metrics highlight.
Alphabet’s Uniform ROA has actually been higher than its as-reported ROA in the past sixteen years. For example, as-reported ROA was 9% in 2019, but its Uniform ROA was actually almost 3x higher at 24%.
Historically, Alphabet’s Uniform ROA has ranged from 24%-85% in the past sixteen years while as-reported ROA has only ranged from 9%-26% in the same timeframe.
After gradually declining from a peak of 85% in 2004 to 41% in 2008, Uniform ROA slightly improved to 43% in 2009 before compressing to 24% in 2019.
Alphabet’s Uniform earnings margins are weaker than you think, but its robust Uniform asset turns make up for it
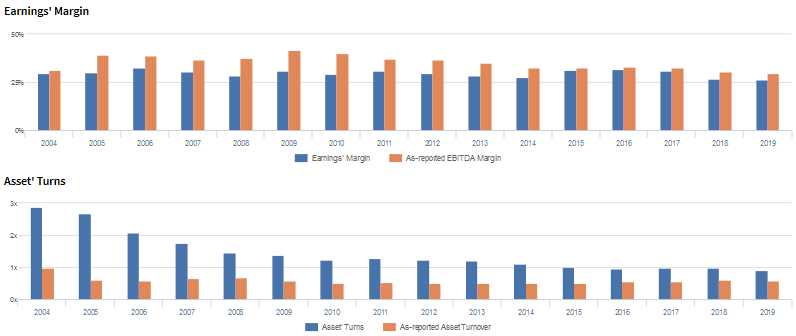
Alphabet’s declining profitability has been driven by fading Uniform asset turns, coupled with generally stable Uniform earnings margins.
Uniform turns gradually declined from a peak of 2.9x in 2004 to 1.2x-1.3x levels in 2010-2013, before further compressing to a 0.9x trough in 2019.
Meanwhile, since 2004, Uniform margins have ranged from 26%-32%, and currently sits at the low end of that range.
At current valuations, markets are pricing in expectations for Uniform margins to decline to new lows and for Uniform turns to continue compressing.
SUMMARY and Alphabet Tearsheet
As the Uniform Accounting tearsheet for Alphabet Inc. (GOOGL:USA) highlights, the Uniform P/E trades at 23.6x, which is around corporate average valuation levels but above its own recent history.
Average P/Es require average EPS growth to sustain them. In the case of Alphabet, the company has recently shown an 18% Uniform EPS growth.
Wall Street analysts provide stock and valuation recommendations that in general provide very poor guidance or insight. However, Wall Street analysts’ near-term earnings forecasts tend to have relevant information.
We take Wall Street forecasts for GAAP earnings and convert them to Uniform earnings forecasts. When we do this, Alphabet’s Wall Street analyst-driven forecast is a 6% EPS contraction in 2020, followed by a 17% EPS growth in 2021.
Based on current stock market valuations, we can use earnings growth valuation metrics to back into the required growth rate to justify Alphabet’s $1,581 stock price. These are often referred to as market embedded expectations.
The company needs Uniform earnings to grow 4% each year over the next three years to justify current prices. What Wall Street analysts expect for Alphabet’s earnings growth is below what the current stock market valuation requires in 2020, but above its requirement in 2021.
Furthermore, the company’s earning power is 4x the corporate average. Also, cash flows are almost 5x higher than its total obligations—including debt maturities, capex maintenance, and dividends. Together, this signals a low credit and dividend risk.
To conclude, Alphabet’s Uniform earnings growth is above its peer averages in 2020, but the company is trading below its average peer valuations.
About the Philippine Markets Daily
“Thursday Uniform Earnings Tearsheets – Global Focus”
Some of the world’s greatest investors learned from the Father of Value Investing or have learned to follow his investment philosophy very closely. That pioneer of value investing is Professor Benjamin Graham. His followers:
Warren Buffett and Charles Munger of Berkshire Hathaway; Shelby C. Davis of Davis Funds; Marty Whitman of Third Avenue Value Fund; Jean-Marie Eveillard of First Eagle; Mitch Julis of Canyon Capital; just to name a few.
Each of these great investors studied security analysis and valuation, applying this methodology to manage their multi-billion dollar portfolios. They did this without relying on as-reported numbers.
Uniform Adjusted Financial Reporting Standards (UAFRS or Uniform Accounting) is an answer to the many inconsistencies present in GAAP and IFRS, as well as in PFRS.
Under UAFRS, each company’s financial statements are rebuilt under a consistent set of rules, resulting in an apples-to-apples comparison. Resulting UAFRS-based earnings, assets, debts, cash flows from operations, investing, and financing, and other key elements become the basis for more reliable financial statement analysis.
Every Thursday, we focus on one multinational company that’s particularly interesting from a UAFRS vs as-reported standpoint. We highlight one adjustment that illustrates why the as-reported numbers are unreliable.
This way, we gain a better understanding of the factors driving a particular stock’s returns, and whether or not the firm’s true profitability is reflected in its current valuations.
Hope you’ve found this week’s Uniform earnings tearsheet on a multinational company interesting and insightful.
Stay tuned for next week’s multinational company highlight!
Regards,
Angelica Lim
Research Director
Philippine Markets Daily
Powered by Valens Research
www.valens-research.com