
In an industry where low returns are common, this retailer earns Uniform ROAs of 10%+ through supply efficiencies and economies of scale

Grocery stores aren’t particularly the most profitable business. Because most companies offer the same product, they have to compete by offering the lowest price to gain market share, which often leads to lower margins.
For decades, this grocery retailer has consistently operated with thin margins because of its low-price strategy. To compensate for that, the company employed efficient supply chain management and used its scale to its advantage.
However, as-reported metrics don’t seem to capture this company’s true earning power. In reality, Uniform Accounting portrays its real profitability, with returns that have been more robust at 10%+.
Also below, Uniform Accounting Embedded Expectations Analysis and the Uniform Accounting Performance and Valuation Tearsheet for the company.
Philippine Markets Daily:
Thursday Uniform Earnings Tearsheets – Global Focus
Powered by Valens Research
“Always low prices.”
This slogan has attracted millions of customers to Walmart’s (WMT) doors for over 50 years. Although this slogan was revised in 2007, this company is known to have adopted Everyday Low Prices since its inception.
Everyday Low Prices (EDLP) is a pricing strategy wherein the company is able to offer its products at consistently low prices throughout the year without the need for sales/discount days.
In general, grocery stores pretty much sell the same products (not relating to brands, but broader products such as milk or salt, among others). The reason why these companies offer the lowest prices possible in the first place is because customers can easily switch from one store to another.
Unfortunately, this is also the reason why grocery stores often operate with lower margins, and therefore have lower profitability.
On the bright side, the EDLP strategy promises booming sales volume, and more importantly, customer loyalty, as demonstrated by Costco (COST). The difference is, Costco uses a membership model to pull customers in—Walmart doesn’t.
And yet, Walmart still enjoys robust returns similar to Costco. This is because Walmart uses a different strategy to increase customers and profitability: through supply chain efficiency and economies of scale.
The company implemented a supply chain initiative called Vendor Managed Inventory (VMI) where the vendors themselves are responsible for restocking their inventory in Walmart’s warehouses.
Moreover, as part of the VMI initiative, Walmart enforced cross-docking to save more on time and costs. Cross-docking is a logistics activity where goods are directly transported from the manufacturer’s inbound trucks to the retailer’s outbound truck, thereby eliminating unnecessary storage.
In addition to these initiatives, technology has played a significant role in the implementation of its structures and the foundations of its supply chain management. From the use of barcodes in 1983 to RFID technology in 2005, and in the past five years, new programs for inventory management including My Productivity and Top Stock.
As for economies of scale, Walmart is the world’s largest retailer with over 10,500 stores globally. To illustrate that magnitude, about 90% of the U.S.’ total population lives within 15 miles (or 24 kilometers) of a Walmart.
The company leverages on its size by purchasing in bulk and getting volume discounts from suppliers.
So, even though Walmart operates on thin margins, through supply chain efficiency and economies of scale, the company is able to maximize its working capital management to earn higher returns.
That said, return on assets (ROA) have been consistently below 9% over the past sixteen years.

However, Walmart’s robust profitability is more accurately displayed by Uniform Accounting, with Uniform ROAs that have actually been north of 10%. This reflects the company’s effective supply chain management and use of economies of scale to earn higher returns.

What as-reported metrics fail to consider is how current liabilities are factored into the ROA calculation. Traditional ROA calculations for measuring a firm’s earning power only include current and long-term assets as part of the cost of investment.
However, a company’s ability to receive goods and services in advance of payments—the current operating liabilities—ought to be factored in as well.
Current liabilities (excluding short-term debt) are necessary for operations. Items such as accounts payable, accrued expenses, and others are used to maintain the firm’s current capital position. On the other hand, long-term liabilities are mostly just used to finance the business.
If a company has a ton of cash to service its current liabilities and we only factor in its cash, it would make the company look inefficient. In reality, the company is just being responsible by building liquid assets to meet short-term obligations.
As such, net working capital (current assets less current liabilities) is used for the firm’s ROA calculation. This shows a company’s real cash management ability and thereby, its true earning power.
In the case of Walmart, as-reported metrics’ asset base for ROA calculation is at $252.5 billion in 2021, leading to a 7% as-reported ROA.
However, when subtracting current operating liabilities and applying other needed adjustments, we arrive at Walmart’s $166.1 billion Uniform assets, resulting in an 11% Uniform ROA.
Walmart is actually more profitable than you think it is

As-reported metrics distort the market’s perception of the firm’s recent profitability. If you were to just look at as-reported ROA, you would think the company is a much weaker business than real economic metrics highlight.
Walmart’s Uniform ROA has actually been higher than its as-reported ROA in the past sixteen years. For example, Uniform ROA was at 11% in 2021, while as-reported ROA was only at 7%.
Specifically, Walmart’s Uniform ROA has ranged from 8%-14% in the past sixteen years while as-reported ROA has ranged from only 6%-9% levels in the same time frame.
Uniform ROA was maintained at 13%-14% levels from 2006 to 2012, before gradually decreasing to 8% in 2019 and subsequently expanding to 11% in 2021.
Walmart’s Uniform earnings margin is weaker than you think, but its Uniform asset turns make up for it
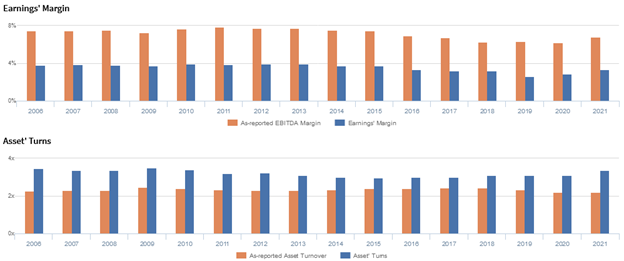
Declines in Uniform ROA have been driven by compounding trends in Uniform asset turns and Uniform earnings margin.
Uniform turns declined gradually from 3.4x-3.5x levels in 2006-2010 to 3.0x levels in 2014-2017, before recovering back to 3.4x levels in 2021.
Meanwhile, Uniform margins were stable at 4% levels from 2006-2015, but have since declined to 3% levels through 2021.
At current valuations, the market is pricing in expectations for a reversal of recent declines in both Uniform margins and Uniform turns.
SUMMARY and Walmart Inc. Tearsheet
As the Uniform Accounting tearsheet for Walmart Inc. (WMT:USA) highlights, the Uniform P/E trades at 27.5x, which is above the global corporate average of 23.7x and its historical Uniform P/E of 25.6x.
High P/Es require high EPS growth to sustain them. In the case of Walmart, the company has recently shown a 37% Uniform EPS growth.
Wall Street analysts provide stock and valuation recommendations that provide very poor guidance or insight in general. However, Wall Street analysts’ near-term earnings forecasts tend to have relevant information.
We take Wall Street forecasts for GAAP earnings and convert them to Uniform earnings forecasts. When we do this, Walmart’s Wall Street analyst-driven forecast is a 15% EPS shrinkage in 2022 and a 17% EPS growth in 2023.
Based on current stock market valuations, we can use earnings growth valuation metrics to back into the required growth rate to justify Walmart’s $141 stock price. These are often referred to as market embedded expectations.
The company is currently being valued as if Uniform earnings were to grow by 2% annually over the next three years. What Wall Street analysts expect for Walmart’s earnings growth is below what the current stock market valuation requires in 2022 but above its requirement in 2023.
Furthermore, the company’s earning power is 2x the corporate average. Also, cash flows and cash on hand are about 2x higher than its total obligations—including debt maturities, capex maintenance, and dividends. Together, this signals a low credit and dividend risk.
To conclude, Walmart’s Uniform earnings growth is below its peer averages, but the company is trading around average peer valuations.
About the Philippine Market Daily
“Thursday Uniform Earnings Tearsheets – Global Focus”
Some of the world’s greatest investors learned from the Father of Value Investing or have learned to follow his investment philosophy very closely. That pioneer of value investing is Professor Benjamin Graham. His followers:
Warren Buffett and Charles Munger of Berkshire Hathaway; Shelby C. Davis of Davis Funds; Marty Whitman of Third Avenue Value Fund; Jean-Marie Eveillard of First Eagle; Mitch Julis of Canyon Capital; just to name a few.
Each of these great investors studied security analysis and valuation, applying this methodology to manage their multi-billion dollar portfolios. They did this without relying on as-reported numbers.
Uniform Adjusted Financial Reporting Standards (UAFRS or Uniform Accounting) is an answer to the many inconsistencies present in GAAP and IFRS, as well as in PFRS.
Under UAFRS, each company’s financial statements are rebuilt under a consistent set of rules, resulting in an apples-to-apples comparison. Resulting UAFRS-based earnings, assets, debts, cash flows from operations, investing, and financing, and other key elements become the basis for more reliable financial statement analysis.
Every Thursday, we focus on one multinational company that’s particularly interesting from a UAFRS vs as-reported standpoint. We highlight one adjustment that illustrates why the as-reported numbers are unreliable.
This way, we gain a better understanding of the factors driving a particular stock’s returns, and whether or not the firm’s true profitability is reflected in its current valuations.
Hope you’ve found this week’s Uniform earnings tearsheet on a multinational company interesting and insightful.
Stay tuned for next week’s multinational company highlight!
Regards,
Angelica Lim
Research Director
Philippine Markets Daily
Powered by Valens Research
www.valens-research.com


