
Leveraging its business through debt instruments helped this company expand and achieve above cost-of-capital returns, not below

One of the ways for a company to gain additional capital is through debt financing.
Today’s company has historically issued bonds to fund its ambitious expansion and is now one of Philippine companies that holds one of the highest debt ratios.
However, recent as-reported metrics seem to understate the company’s ability to manage its debt, showing that its strategy severely harms the company.
Also below, Uniform Accounting Embedded Expectations Analysis and the Uniform Accounting Performance and Valuation Tearsheet for the company.
Philippine Markets Daily:
Tuesday Uniform Earnings Tearsheets – Philippine-listed Focus
Powered by Valens Research
In 2020, many companies deferred investment or expansion to ensure that their resources would be enough to service near-term obligations.
However, San Miguel Corporation (SMC:PHL) did the opposite by continuously investing heavily in one of its portfolios—infrastructure.
In October 2020, San Miguel announced the completion of one of its infrastructure projects, Skyway Stage 3. This has been the most awaited project of the company for motorists as it reduces the travel time from SLEX to NLEX from three hours to approximately 20 minutes.
San Miguel’s plan was only to build a six-lane elevated expressway with a total of about 14.82 kilometers. However, the initial plan was modified, stretching the project to about 18.83 kilometers. Due to the changes, the total cost of the project came at PHP 44.86 billion.
Before this project, San Miguel had already made several investments in different business lines in the past ten years under its diversification strategy.
Some of these include acquiring a majority control of Petron Corporation (PCOR:PHL) in 2010, buying Exxon’s Malaysia units in 2011, partnering with EEI Corp in 2015, and finally bagging the Bulacan Airport Project in 2019.
Currently, San Miguel is eyeing to build a Skyway extension in the northbound section that will provide an additional three-lane section, which should provide a long-term solution for the traffic congestion in South Luzon Expressway.
Given the company’s series of acquisitions and investments, one would think the company is flush with cash to be able to fund its aggressive expansions.
San Miguel has indeed been raising capital, but not through its equity.
In the past decade, the firm’s debt ratio has never been below 60%, implying that its investments are financed through debt. Now, San Miguel plans on issuing a bond float to manage its debt.
San Miguel is dealing with a PHP 100 billion to PHP 200 billion debt headwall in the next four years, which may be difficult to pay off unless the company refinances its debt. However, if San Miguel’s creditors approve the postponement of its debt repayment, the company should have little trouble paying its other obligations in the near term.

Despite its sizable debt, the company has been able to manage its obligations with its refinancing history.
However, as-reported metrics seem to understate the company’s capacity in settling debt, thinking its strategies harm the company, with as-reported ROAs not surpassing cost-of-capital returns and ranging only from 2%-5%.
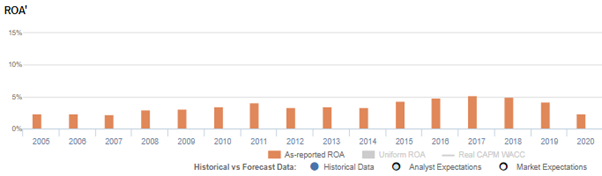
In reality, while the company incurred massive debt for its expansion, the firm’s Uniform data still fared better than its as-reported, with profitability ranging from 2%-8%.
One of the said distortions stems from how Philippine Financial Reporting Standards (PFRS) classifies interest expense.
According to PFRS, interest expense can be classified as an operating cash flow. In reality, interest expense represents the cost of debt and is rightfully only a financing cash flow. As such, in Uniform Accounting, interest expense is added back to earnings.
As a firm that made a lot of investments through debt, San Miguel’s recognized interest expense from its debt.
Specifically in 2020, it recorded a PHP 52 billion interest cost. Adding back this expense because it is not an operating expense, with many other necessary adjustments made by Valens, leads to a PHP 39 billion net income and 4% Uniform ROA, higher than PHP 2.9 billion as-reported net income and 2% as-reported ROA.
San Miguel’s earning power is stronger than you think
As-reported metrics distort the market’s perception of the firm’s historical profitability. If you were to just look at as-reported ROA, you would think that San Miguel’s profitability is stronger than real economic metrics have highlighted.
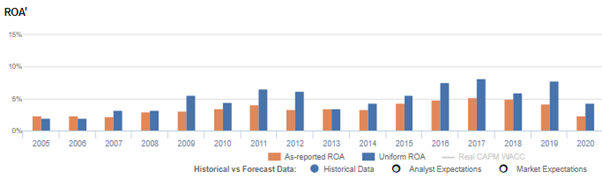
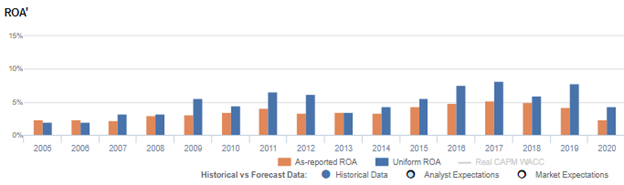
In reality, San Miguel’s true profitability has generally been higher than its as-reported ROA for the past sixteen years. Specifically, as-reported ROA was 2% in 2020, but Uniform ROA was only 4% that year.
As-reported ROA expanded from 2% in 2005-2007 to 4% in 2011, before fading to 3% in 2012-2014. Then, as-reported ROA rose to a peak of 5% in 2016-2018, only to decline to 2% in 2020.
Meanwhile, Uniform ROA improved from 2% in 2005-2006 to 7% in 2011, before declining to 4% in 2013-2014. Thereafter, Uniform ROA recovered until it reached a peak of 8% in 2016-2017, before compressing back to 4% in 2020.
San Miguel is a more efficient business than you think

Historically, as-reported metrics have significantly understated the firm’s asset efficiency.
In 2020, as-reported asset turnover was 0.4x compared to Uniform asset turns of 0.8x, making the company appear to be a less efficient business than real economic metrics highlight.
Moreover, as-reported asset turnover has been lower than Uniform turns each year since 2005.
After slightly recovering from 0.4x in 2005-2006 to 0.5x in 2007-2008, as-reported asset turnover fell to a trough of 0.3x in 2010. As-reported asset turnover then expanded to 0.7x in 2012, before gradually fading to 0.4x in 2020.
Meanwhile, Uniform asset turns slowly improved from 0.6x in 2005-2006 to a high of 1.2x in 2019, excluding 0.5x underperformance in 2010. Since then, however, Uniform asset turns have dropped to 0.8x in 2020.
As-reported asset turnover has been distorting the market’s perception of the firm’s historical asset efficiency levels for more than a decade.
SUMMARY and San Miguel Corporation Tearsheet
As the Uniform Accounting tearsheet for San Miguel Corporation (SMC:PHL) highlights, it trades at a Uniform P/E of 26.9x, above the global corporate average of 23.7x but around its historical average of 27.1x.
High P/Es require high EPS growth to sustain them. In the case of San Miguel, the company has recently shown a 100% Uniform EPS shrinkage.
Sell-side analysts provide stock and valuation recommendations that in general provide very poor guidance or insight. However, sell-side analysts’ near-term earnings forecasts tend to have relevant information.
We take sell-side forecasts for PFRS earnings and convert them to Uniform earnings forecasts. When we do this, San Miguel’s sell-side analyst-driven forecast calls for an immaterial EPS growth for 2021 and a 6% EPS shrinkage for 2022.
Based on current stock market valuations, we can use earnings growth valuation metrics to back into the required growth rate to justify San Miguel’s PHP 119.00 stock price. These are often referred to as market embedded expectations.
San Miguel is currently being valued as if Uniform earnings were to grow 8% annually over the next three years. What sell-side analysts expect for Uniform earnings growth is below what the current stock market valuation requires in 2021 and 2022.
The company’s earning power is below the long-run corporate average. Also, cash flows and cash on hand are below its total obligations—including debt maturities and capex maintenance. Together, this signals a high dividend and credit risk.
To conclude, San Miguel’s Uniform earnings growth is below peer averages, but is currently trading near average peer valuations.
About the Philippine Market Daily
“Tuesday Uniform Earnings Tearsheets – Philippine-listed Focus”
Some of the world’s greatest investors learned from the Father of Value Investing or have learned to follow his investment philosophy very closely. That pioneer of value investing is Professor Benjamin Graham. His followers:
Warren Buffett and Charles Munger of Berkshire Hathaway; Shelby C. Davis of Davis Funds; Marty Whitman of Third Avenue Value Fund; Jean-Marie Eveillard of First Eagle; Mitch Julis of Canyon Capital; just to name a few.
Each of these great investors studied security analysis and valuation, applying this methodology to manage their multi-billion dollar portfolios. They did this without relying on as-reported numbers.
Uniform Adjusted Financial Reporting Standards (UAFRS or Uniform Accounting) is an answer to the many inconsistencies present in GAAP and IFRS, as well as in PFRS.
Under IFRS, each company’s financial statements are rebuilt under a consistent set of rules, resulting in an apples-to-apples comparison. Resulting UAFRS-based earnings, assets, debts, cash flows from operations, investing, and financing, and other key elements become the basis for more reliable financial statement analysis.
Every Tuesday, we focus on one Philippine-listed company that’s particularly interesting from a UAFRS vs as-reported standpoint. We highlight one adjustment that illustrates why the as-reported numbers are unreliable.
This way, we gain a better understanding of the factors driving a particular stock’s returns, and whether or not the firm’s true profitability is reflected in its current valuations.
Hope you’ve found this week’s Uniform Earnings Tearsheet on a Philippine company interesting and insightful.
Stay tuned for next week’s Philippine company highlight!
Regards,
Angelica Lim
Research Director
Philippine Markets Daily
Powered by Valens Research
www.valens-research.com


