
MONDAY MACRO: Let’s get Physical Capital! Uniform Accounting shows it’s a good time for capex spending to support earnings growth and 7% GDP growth

For decades, the Philippines used to be called the “sick man of Asia” because of its poor economic performance, slow GDP growth, low incoming investments, and a business environment that was overall not competitive enough.
This changed a few years ago, with the Philippines now recognized as “Asia’s rising tiger,” as the second-fastest growing emerging market in the world.
One of the main contributors to this fast-paced growth is the country’s BPO industry, which had just 100,000 employees in 2004 to over 1 million employees 10 years later. The demand for fluent English-speaking customer representatives spurred the demand for more office spaces. Eventually, even the country’s real estate began to see both rise in activity and in prices.
This metric that we’re highlighting focuses on how physical asset growth is a key element to support the stable 6%-7% Uniform return on assets that the Philippines will continue to enjoy.
Philippine Markets Daily:
The Monday Macro Report
Powered by Valens Research
The Cobb-Douglas production function might be a familiar equation to students of macroeconomics.
Created by Paul H. Douglas and Charles W. Cobb, this function illustrates the relationship between two factors of production–the labor capital and the physical capital.
It assumes that total production is a product of total factor productivity, the percent contribution of labor, and the percent contribution of physical capital.
Economists use this as the first step to determine the growth rate of potential GDP.
(Potential GDP is the output level that an economy can sustain over a long period of time.)
To calculate potential GDP growth rate, we’ll need to transform the Cobb-Douglas function by using long-term growth rate figures instead.
Once we do, we arrive at the labor productivity growth accounting equation.
This equation shows that the growth rate in potential GDP is the sum of two long-term growth rates: long-term growth rate of labor force and long-term growth rate in labor productivity.
The long-term growth rate of labor force is not new to most of us. We normally use this to describe country demographics and employment.
The Philippines is enjoying the benefits of having one of the youngest populations in the ASEAN region, with a median age of 23.5 years.
The labor force participation rate is expected to remain at 61%-62% while population growth is expected to be 1.2% on average for the next 25 years.
What we don’t normally hear about is the long-term growth rate in labor productivity, which includes adding more physical assets and technological progress.
To understand where the Philippines is in the capex cycle, we need to understand what the state of companies’ physical capital is—the state of their Property, Plant, and Equipment (PP&E).
Property, Plant, and Equipment are fixed assets that companies use to run their daily operations. This includes office space, factories, production machinery, and vehicles.
These long-term assets have a useful life before they become obsolete, begin breaking down, or need to be replaced.
Through a process called depreciation, companies record the value of their PP&E based on the assets’ current lives.
To understand where a company is in their capex cycle, we need to know if a company has been investing in their PP&E.
Have they been putting off new investments by opting to just repair their machinery?
Have they been underinvesting because of budget limitations?
Or have they been overly investing, potentially unnecessarily?
The Net/Gross PP&E ratio is a great proxy to identify how many old assets a company has.
It can help in understanding when companies have been “milking” their balance sheets or ramping up investment in the face of expected growth opportunities.
It shows whether companies have decided to either invest in their assets to drive growth when it rises, or defer maintenance capex and manage cash flows when it falls.
Tracking the Net/Gross PP&E ratios over time tells us when companies need to spend more money to support operations and when the need to reinvest is less urgent.
It can also tell a larger story about larger investment trends across an industry.
However, you can’t use the net and gross PP&E numbers you’ll find on the as-reported financial statements.
There are just too many issues around acquisition, asset write-downs, and bankruptcy “fresh start” accounting, to name a few, that are on the Philippine Financial Reporting Standards (PFRS).
Uniform Accounting (UAFRS) addresses this issue.
The chart below shows the Net/Gross PP&E ratio for a group of listed Philippine companies, using Uniform data since the second half of 2007.
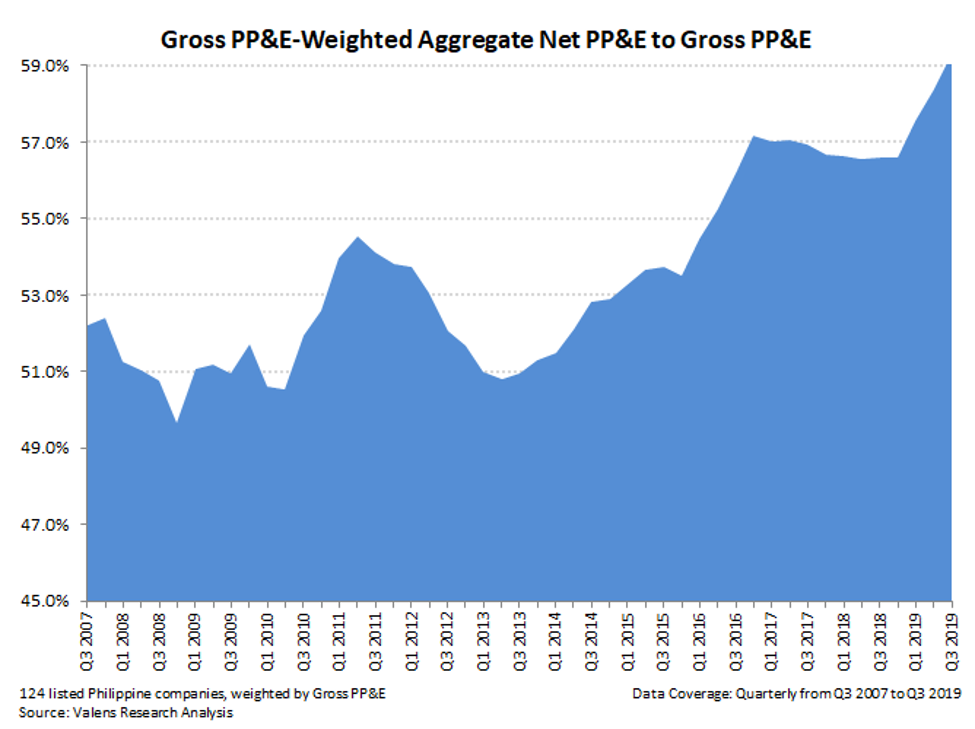
The recovery since 2013 has been due to investment in companies in replenishing their capital stock that rose to 59% in Q3 2019.
This significant rise highlights that companies have been aggressively spending on capex. This is likely to continue if businesses want to widen their growth prospects, and invest more in expanding production capacities.
To further illustrate this point, we can look at the capacity utilization of the Philippines.
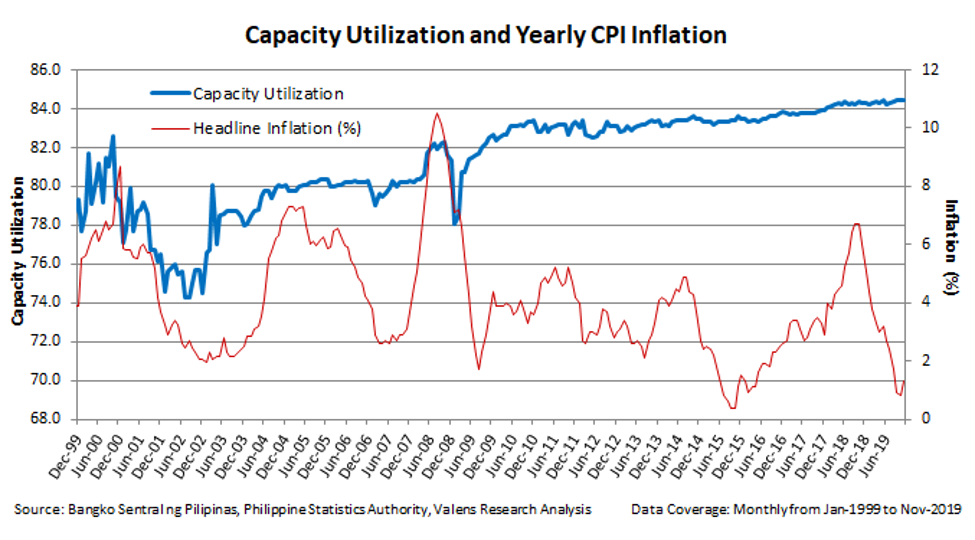
The capacity utilization rate is used to determine how much slack is currently in the system in terms of capacity to increase volumes without spending on capex.
From 1999 until 2018, capacity utilization in the Philippines averaged 81%.
After falling to 78% in January 2009, capacity utilization bounced back to 80% levels in the same year before gradually increasing to current peak levels
Based on the Philippine Statistics Authority, 65% of the major industries in the Philippines operated at over 80% capacity utilization.
This means that in order to facilitate incremental growth, capex spending is very likely.
The Philippines’ major trading partners are seeing similar trends in capex spending.
Net/Gross PP&E for US companies reached multi-decade lows by mid-2018, falling to sub-55% levels.
By Q3 2019, Net/Gross PP&E ratios rose to 59% levels not seen since 2016, highlighting a significant surge in maintenance capex.
Likewise, Chinese companies have also rebounded to 56.8% in Q4 2019 from 56.6% in the previous quarter, an increase of 20bps.
If we continue to see this growth, and since we don’t see any impending credit risks, then the 7% 2020 growth target set by the Philippine government is a likely scenario.
About the Philippine Markets Daily
“The Monday Macro Report”
When just about anyone can post just about anything online, it gets increasingly difficult for an individual investor to sift through the plethora of information available.
Investors need a tool that will help them cut through any biased or misleading information and dive straight into reliable and useful data.
Every Monday, we publish an interesting chart on the Philippine economy and stock market. We highlight data that investors would normally look at, but through the lens of Uniform Accounting, a powerful tool that gets investors closer to understanding the economic reality of firms.
Understanding what kind of market we are in, what leading indicators we should be looking at, and what market expectations are, will make investing a less monumental task than finding a needle in a haystack.
Hope you’ve found this week’s macro chart interesting and insightful.
Stay tuned for next week’s Monday Macro report!
Regards,
Angelica Lim & Joel Litman
Research Director & Chief Investment Strategist
Philippine Markets Daily
Powered by Valens Research
www.valens-research.com


